Quantcast
Channel: Infragistics Community
Viewing all 2223 articles
Browse latest View live

Making Big Data Useful: Design, UX and Innovation

$
0
0

On October 23-24, 2015 I’ve been invited to speak at the User Centered Design (UCD) conference held annually in London. This is a more interesting conference than most (to me) because the talks center around the disruptive and transformative power of design rather than the usual UX presentation topics.

My talk, entitled Making Data Useful: Design, UX and Innovation, focuses on how the design process can be applied to the problem of large data sets. Most importantly, I discuss that while there is a lot of discussion about how big data holds the promise of business growth, large scale innovation, and, perhaps most importantly, insight, there is one fundamental problem: People neither act on, nor infer insight from, data. In fact, unless you’re a machine, data on its own is useless. Someone needs to translate the data into information. And it’s not easy to do (even if you realize that it needs to be done).

 big_data

Some businesses have begun hiring specialized data analysts to apply machine learning, data compression and other complex algorithmic processes in order to expose statistical relationships between data elements. This approach looks for structure and then attempts to assign meaning. That’s one problem. Another lies with the fact that the larger the data set, the more likely “significant” results will be due to chance.

Most businesses, however, don’t understand the difference between data and information and focus instead on converting data into charts and graphs – dashboards. While dashboards may look nicer than spreadsheets, they are usually just visual representations of data. (However, take a look at some work by the talented UX people at Infragistics to see what can happen when dashboards are done right). The dashboard user is left with the unenviable task of trying to translate the data into a form that is both meaningful and actionable (re: information).

My presentation demonstrates how applying the design process to the problem of large data sets can bridge the gap between the technical challenge of data collection and the human challenge of data interpretation. If you’re in London, stop on by – the first pint is on me.

Big Data” image courtesy of Spencer Levine.

---------------------------------------------------------

Kevin Richardson has been working in the area of user experience for 25 years. With a PhD in Cognitive Psychology, he has experience across business verticals in the fields of research, evaluation, design and management of innovative, user-centered solutions.

Kevin’s experience includes web sites, portals and dashboards, enterprise software and custom business applications for medical, pharmaceutical, communications, entertainment, energy, transportation and government users.

On the weekends, you can find Kevin on his motorcycle, racing for Infragistics Racing at a number of different racetracks on the East coast.


What's new in Indigo Studio 2015 Vol.2

$
0
0

It’s full of much requested features, and we know that you are going to love it! :)

FYI, we are changing how we name major releases for Indigo Studio. Instead of calling it version 6.0, it’s now Indigo Studio 2015 Vol.2. The first number is for the year of release (e.g., 2015) and the volume number indicates whether it’s the first or second major release for that year (e.g., Vol. 2). In addition to the two major releases every year, we ship periodic updates. The update number is appended to the major release name. For example, Indigo Studio 2015 Vol. 2 (Update 1).

We feel this naming convention will be simpler to understand and emphasize our unrelenting focus in delivering the most capable and rapid UX-Flow prototyping tool!

If you haven’t been updating regularly, here is the list of highlighted features we added since the last major version of Indigo Studio:

Check the following link for a complete list of past releases: http://indigo.infragistics.com/help/releasenotes

Add Comments to Prototypes

Commenting is part of indigodesigned.com, our free prototype hosting service for unlimited number of prototypes. We announced indigodesigned.com a while back, and is the quickest way to share your prototypes in the cloud. 

Any prototype you share on indigodesigned.com will have support for commenting. To enable comments, simply upgrade to the latest version of Indigo Studio, and share your prototype with the Enable Commenting option checked.

Try adding comments

Manage Comments

Features related to commenting

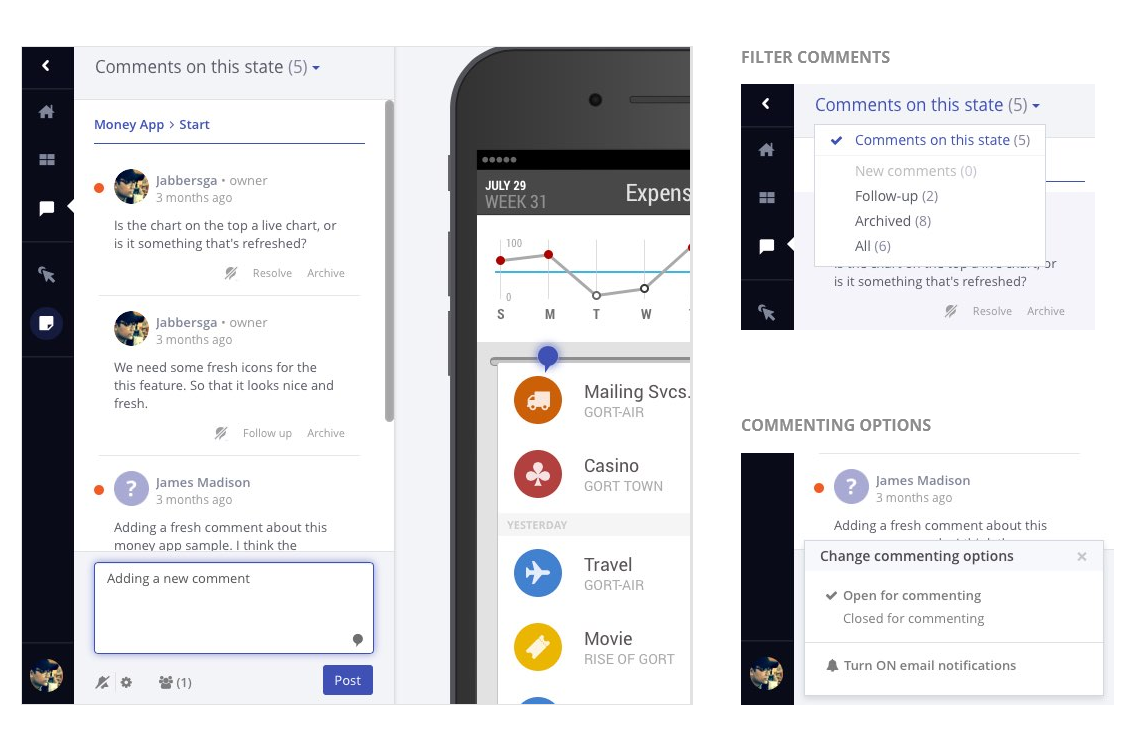
Comments are shown in a side-bar as opposed to on top of the prototype. This way, you can read and add comments without interfering with the navigation. Comments are unique to each UI state, so as you navigate, the comments panel will update accordingly.

The prototype owner will have the ability to mark comments for follow-up or archive previous comments. Once you do this, you can use the filter in the comment sidebar to filter those comments.

You can also open or close commenting at any time. When comments are closed, reviewers will be unable to add new comments, but existing comments will still be shown. Comments are not available for prototypes marked as community.

Email Notifications, Real-time Comments, and Adding Markers

Naturally, that’s not all! In addition to adding comments, we have also added the following related features:

  • Email notifications Anyone you share the prototype link with can subscribe to receive email notifications when new comments are added to the share.

  • Real time comments As the name suggests, comments panel will update automatically without requiring you to refresh the prototype.

  • Adding comment markers You will be able to drop a marker to visually connect a comment with the UI/prototype.

Install indigodesigned.com on Premises

Enterprise customers can opt to install indigodesigned.com on premises behind their corporate firewall. This will allow you to control where the prototypes and UI libraries are stored, and provides an additional level of security and privacy. In nutshell, get all the capabilities, for sharing and collaboration, available just for your users. You can even authenticate using your existing credentials without requiring an infragistics.com account.

Go ahead and share prototypes or UI libraries that others in your organization can freely access and download! Contact us for details

Use Collections to Organize & Share Your UX Prototypes

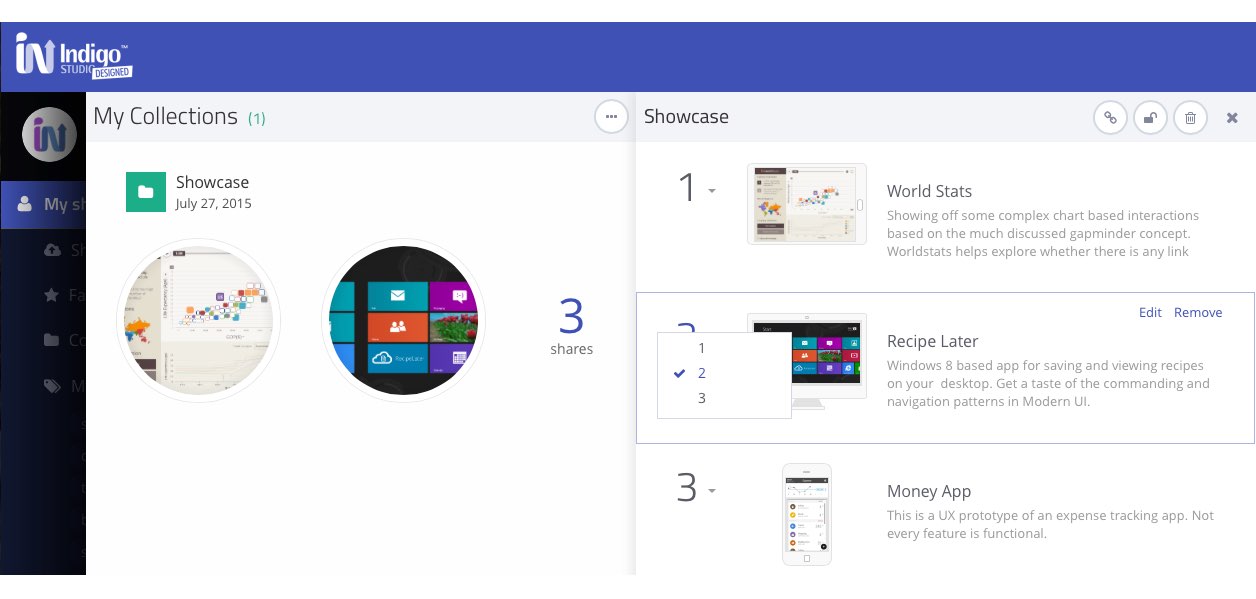
Collections are like folders for your shares on indigodesigned.com, with the following tweaks:

  • You can reorder the items/shares in a collection like a playlist.
  • You can grab a single link to the entire collection, which you can then send someone
  • Deleting a collection does not affect the contained shares
  • You can password-protect a collection, and bypass passwords on individual shares.

View Collections

To create a collection, select a set of prototypes you have shared on indigodesigned.com, and use the add to collection action to create a new collection or add to an existing one.

Inline text formatting or Rich Text Support

It seems like a small thing, but it’s big! So big that it was the second highest voted idea in uservoice. And now you have it.

Rich text

Docking Properties Panel

Dock/pin the properties panel to the right of the design surface, so that it’s integrated with the toolbox. When docked, this panel will share the space with the other toolbox items (i.e., UI elements, screenparts). You can make the PE taller using the splitter or double click the splitter to fit.

Docking Properties Panel

Rulers & Guides

Add a new guide by either clicking in the ruler area or by using the click + drag action. You can still double click on a guide to type in a precise value.

Adding guides

Download and Import UI Libraries from indigodesigned.com

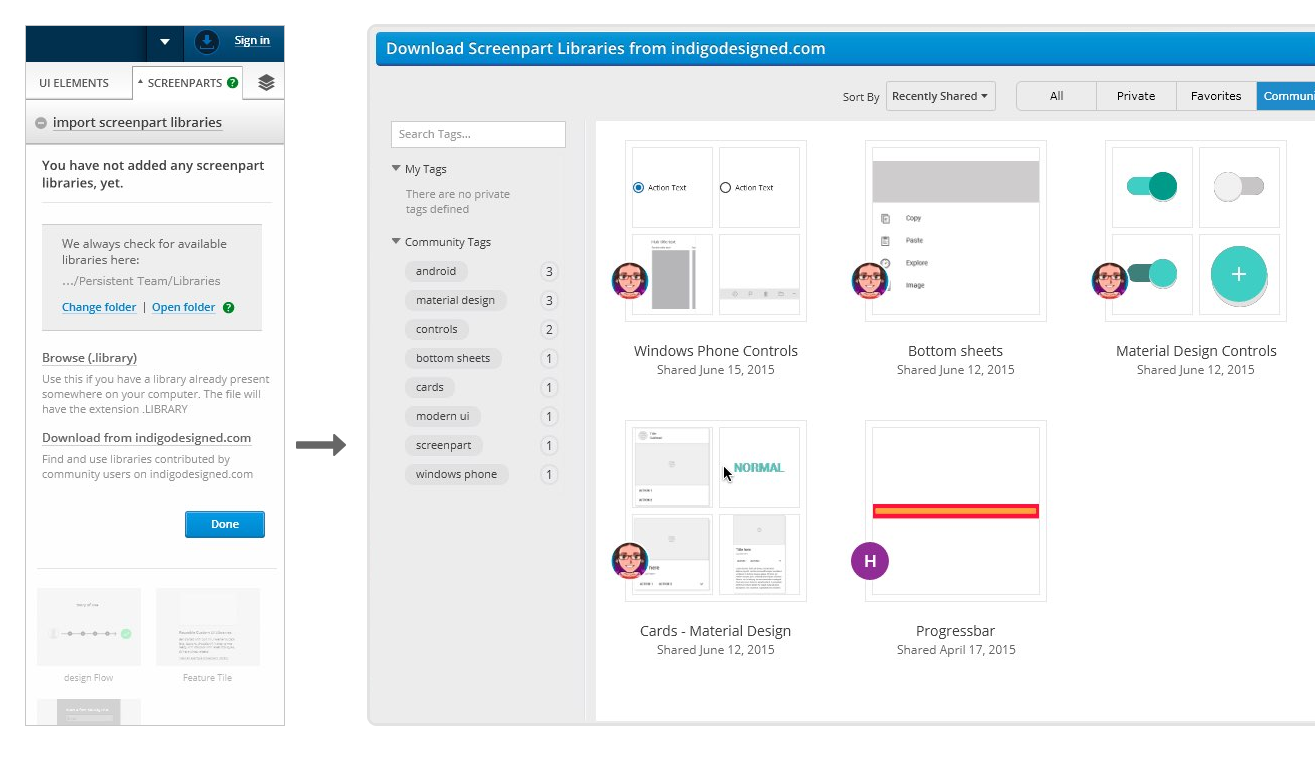
You can explore, download and import UI libraries shared by community users without leaving the Indigo Studio application. UI libraries, also known as screenparts, are reusable custom UI elements created using Indigo Studio.

Importing Screenpart libraries

Downloaded UI libraries are added to a common default folder on your desktop, accessible to all new Indigo Studio projects. You can also change this folder to point to a shared folder anywhere on your network. This way different users can have access to the downloaded libraries as long as they have access to the shared folder.

All Icons from FontAwesome

We have added all the icons from the FontAwesome collection, which increases the tally to 800+ icons ready for use whether you are offline or online. All icons are vector, so you can be assured that these will render perfectly irrespective of screen resolution.

Icon Picker

Options to Flip and Rotate icons

You have new options to quickly mirror icons vertically or horizontally in addition to rotating them clockwise or anti-clockwise. For now these actions are only available for icons.

Rotate or Flip icons

Text Value based Interactions

Specify interactions based on the value specified in the text field. When adding an interaction on a text field, pick changes as the interaction, and specify a target value. You can add more than one text field value to define multiple if-then scenarios.

For example:

  •  When user changes the text field to “Foo," do X.
  •  When user changes the text field to “Bar," do Y.

Text value based interactions

How to get this Update?

Here’s how you can update the version of Indigo Studio installed on your machine:

  • If you have the option to automatically check for updates on startup checked, you should see a dialog box pop up when you launch Indigo. Simply click update, and Indigo Studio will do the rest. This is the easier approach.
  • If for some reason you chose not to automatically check for updates, go to MENU > HELP & ABOUT and use the “CHECK FOR UPDATES option.

Checking for Updates

About Indigo Studio for Interaction Prototyping

Don’t have Indigo Studio? Download a free 30-day trial which will let you try all of the prototyping goodness!

Download Indigo Studio

Looking to suggest improvements and new ideas for Indigo Studio?

Submit a new idea

If for some reason you are having trouble with Indigo Studio, check out our help topics, forums or contact support.

Get Support

Follow us on Twitter @indigodesigned

View Release Notes

Announcing Infragistics Ultimate 15.2: Download Today!

$
0
0

We are very excited to announce that Infragistics Ultimate 15.2 is now released to market and available for all users to download!

The Internet of Things (IoT); computing everywhere; advanced, pervasive analytics with the increasing demand that every app now needs to be an analytic app; rapid prototyping and more are fast growing technology trends which bring tremendous opportunities for new products and services, optimized work flow, reduced operational costs and new revenue streams.  With the right tools and services, enterprises of all sizes can turn these opportunities into benefits.

With Ultimate 15.2 we have ensured that you are fully equipped to leverage the new trends – bring huge volumes of data to live with Ignite UI powerful data visualization capabilities, rapidly prototype and collaborate on app experiences before you write any code with Indigo Studio, secure the needs of the mobile user in different contexts and environments with our new advanced features for iOS and Android developers and many more.

We have added new features, new controls and new updates across all platforms to achieve these results, see in details what we did:


To get started Download Infragistics Ultimate 15.2 today:

If you have any feedback, please shoot me an email to jasonb@infragistics.com, and as always please use our User Voice site to include product feature suggestions for future releases.


What's New in Ignite UI: HTML5, jQuery & ASP.NET MVC for 15.2

$
0
0

Ignite UI™ is the most powerful set of high performance user experience controls and components for development of modern apps in HTML5, JavaScript or ASP.NET MVC. If you are building responsive web apps that target the desktop and mobile, or just hybrid mobile apps, Ignite UI can get you there. We are continuing to invest in rich line-of-business scenarios for the desktop browser, while ensuring the touch experiences and mobility are top of mind in our UX process for new controls and control enhancements.   

New Editors

One of our main goals with this release was to provide you with more robust, feature rich and excellent performing editor widgets. Our editor components offer a lot of functionality, backed by a significant amount of code. This latest release marked another major development campaign for the editor suite, since our dev teams re-architected all editors to optimize their usability and also added a new component – the Checkbox widget.

    • igEditors
  • igCheckboxEditor


    • igTextEditor
    • igNumericEditor
  • igPercentEditor

  • igCurrencyEditor

  • igMaskEditor

  • igDateEditor

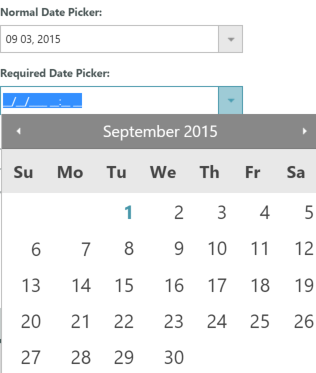
  • igDatePicker

    igNotifier

    The igNotifier component is an extension of the popover component, which specializes in providing the end user with notification information. There are three predefined states:

    • Success
    • Warning
    • Error


    The component supports popover mode, as well as simple inline-style messaging. In addition to this, there is automatic pairing with editor widgets to allow detection or erroneous input which is outside the predefined range.


      igValidator

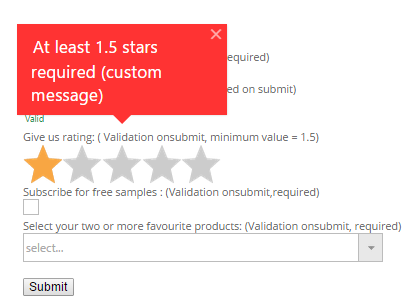
      The new Validation component allows flexible validation on an array of Ignite UI components, as well as standard input form elements. The mechanism uses the Notification component capabilities to both handle the validation process and display flexible and visually appealing notifications to the end user.

      IgniteUI Visual Studio MVC Scaffolder


        We release a brand new Scaffolder for Ignite UI widgets. With this we boost developer productivity greatly by providing code generation and templates to quickly target standard data scenarios like creating, reading, updating and deleting data. With a few clicks you can completely configure a Grid, generate a controller and save time on manual coding. Configuring other widgets as HierarchicalGrid, TreeGrid, Data Chart and others are already in the works.


        Developer Productivity / Features

        igTreeGrid

        In 2015.1 release we added a new control to our grids suite to handle even more hierarchical data scenarios. Now we pack it with tons of features to provide even better experience while dealing with tree or tabular data.

        • Row Selectors


            • Column Moving and Resizing
          • Paging Breadcrumbs


            • Accessibility Rendering (ARIA support)
            • MVC Remote Sorting/Paging/Filtering on all levels


            • Keyboard Navigation
          • Excel Exporter


        igCombo

        The Combo widget gets a big round of new features for this release. Since it was rewritten from the scratch in 2015.1, now you get more goodies to help you deliver better in experience in more use cases.

            • Autocomplete
            • Grouping

              • Header and Footer Templates
              • Dropdown Orientation

              • Support for Custom Values
              • Full element support
              • Full support for ASP.NET MVC 6 for all Ignite UI widgets


          igGrid

          We continually work on the igGrid to improve its user experience and provider richer functionality.

              • Column Auto Sizing
              • Advanced Filter Dialog – Custom Condition


              • Accessibility Rendering (ARIA)
              • Excel Exporter CTP –> RTM
              • Selection / Activation with Focus


          HierarchicalGrid

              • Selection / Activation with Focus
            • Excel Export


          General Enhancements                 

          MVC

              • Tag Helpers for Ignite UI
              • Scaffolding templates with Ignite UI


          igUpload

          transmit additional data between client and server

          Wrapping it up

          That’s it for this big release of Ignite UI. We are investing heavily in modern web - we know that digital transformation and mobilization of your existing desktop applications to mobile devices and browsers are your key initiatives this year and next – Ignite UI will help drive your successful transitions. If you have any questions, shoot me an email at jasonb@infragistics.com, and if you have any ideas for the product or don’t see a feature that you’d like, let us know at the User Voice site so we can hear you voice!


          What's New in Native Mobile for iOS & Android for 15.2

          $
          0
          0

          Android 15.2

          15.2 marks a milestone for our Android product - we are officially RTM'd with the DataChart, and we are introducing a brand new DataGrid, built from the ground up to deliver on the most demanding mobile scenarios.  Our new Data Grid is truly responsive to changes of the available width and orientation of the device. Columns animations, binding remote data along with the local, live scrolling, row selection, and built-in columns are some of the features our Grid provides right out of the box.  The stunning data chart is designed for high-volume and real-time scenarios. Column, Bar, Line, Area, Range, Scatter, Financial, Polar, Radial, Stacked are among the most popular series our Data Chart has. All are zoomable which makes them easy to drill down into the data even on a small device.

          New Grid

          Let's take a look at the features in the new Android Data Grid.

          Data Source

          The Grid's data can be Local, available on the device already, or the grid can retrieve data from a Remote store, e.g. from a web service.

          Built-in Columns

          Create a Grid with auto-generated columns or select the column types among our built-in Columns: Text, Numeric, Image, DateTime, and Template.

          All columns’ cells and headers can be configured by setting text properties like text color, font size, background color, alignment, and width. Numeric Column provides control over the decimal places. Image Column has image stretch options. DateTime Column provides several predefined DateTime formats to choose from, e.g. short date/time, long date/time. The Template Column allows you to customize the layout of content in the column.

          Responsive layout

          Our Grid is dynamically changing the visible columns based on available width by setting break points at different widths or based on the orientation of the device.


          Animation

          You, the developer, or your end user may control columns' Showing, Hiding, Adding, Moving, and Exchanging. Showing, Hiding and Adding Columns’ animations can be configured to slide from left, right, top, bottom and/or to fade in. Exchanging Columns’ animation can be configured to slide to left, right, top, bottom and/or to crossfade. Moving Columns’ animation can be set to slide over.


          Live scrolling

          The data will be retrieved on the fly over the web, as you are scrolling down, thus ensuring high performance of the Grid. This helps to minimize the amount of data that needs to be transmitted to the device.   

          Selection

          Single and Multi-Row Selection is supported in our Grid to allow scenarios like highlighting a row or a master / detail view, etc.


          Android Data Chart RTM

          The Android Data Chart is fully RTM - so all of the charts and visualizations that you've been using are now fully supported.

          Here is a short list of some of the chart types and features we are RTM'ing in 15.2:

              • Category Series
                • Area / Step Area
                • Bar / Bar Side by Side
                • Column / Column Side by Side
                • Spline / Spline Area
                • Point
                • Line
                • Step Line
                • Waterfall
                • Range Category Series
                • Range Area
                • Range Bar
                • Range Column
                • Scatter Series
                • Scatter Points
                • Scatter Lines
                • Scatter Splines
              • Financial Indicators
                • Bollinger Band
                • Typical Price
                • Median Price
                • Moving Average Convergence Divergence
                • Percentage Price Oscillator
                • Percentage Volume Oscillator
                • Absolute Volume Oscillator
                • Relative Strength Index
                • Accumulation Distribution
                • Average True Range
                • Commodity Channel Index
                • Fast Stochastic Indicator
                • Full Stochastic Indicator
                • Rate of Change
                • TRIX
                • Williams %R Indicator
                • Ease of Movement   
                • Detrended Price Oscillator
                • Force Index
                • StochRSI Indicator
                • Standard Deviation
                • On Balance Volume
                • Price Volume Trend
                • Price Channel Overlay
                • Positive Volume Index
                • Money Flow Index
                • Ultimate Oscillator
                • Market Facilitation Index
                • Chaikin Oscillator
              • Trendlines
                • Simple Moving Average
                • Exponential Moving Average
                • Modified Exponential Moving Average
                • Weighted Moving Average
              • Financial Series
                • Candlestick
                • OHLC
              • Crosshair
              • Legend
              • Markers
              • Axis
                • Numeric ( Linear / Logarithmic)
                • Category
              • Panning
              • Zooming

          Gauges

          Radial

          The Radial Gauge contains a number of visual elements, such as a scale with tick marks and labels, a needle, and a number of ranges. The Radial Gauge has different label configurations, like color, extent, and interval. Radial Gauge has different range properties, like color, start and end value. The needle of the Radial Gauge can be configured by setting its color, needle and pivot shapes and outlines. The transitions between different sets of settings can be animated.

          Linear

          The Linear Gauge is useful for showing a single measure on a linear range. It has different label configurations, like color, extent, interval, and position of the first and last labels. The needle of the Linear Gauge can be configured by setting its color, outline, shape, size. The transitions between different sets of settings can be animated.

          BulletGraph

          The Bullet Graph displays a single primary measure and compares it to one or more other measures to create a concise data visualization. It supports a variety of configurations, e.g. orientation, scale, tick marks, ranges and colors along with animated transitions between different sets of settings.


          PieChart


          The main features of the Pie Chart include label configurations, like position and extent, label font properties, controlling pie radius, start angle, sweep direction, exploded slices and distance from center for exploded slices, selected slices, and legend. The ability to prevent the labels from colliding with each other or the slices.

          FunnelChart

          A single series chart that displays data in a funnel shape with a variable number of sections each representing the data as different portions of 100% or to weight the height of the slices based on value. The Funnel Chart can be configured to be inverted, to use Bezier Curve for its shape or weighted slices.

          BarCode


          Code 128 Barcode

          Code 128 Barcode can be used in inventory, shipping and distribution applications. The Code 128 Barcode has different configurations, like label’s color and font, background color, and stretch.


          QR Barcode

          QR (Quick Response) Code Barcode can be used in commercial tracking, entertainment and transport ticketing, product marketing applications.


          iOS 15.2

          New Swift 2.0 and Objective-C language support 

          As always, we’re keeping our API’s up to date with the latest specs. In this release we’ve improved our API’s so that you get the best Swift 2.0 experience as well as a more descriptive API for objective-c. This includes support for Generics, Nullablilty annotation and KindOf.

          BitCode Enabled

          All of our frameworks have Bitcode enabled, so you can distribute your apps and know that they’ll always be optimized for the latest hardware!

          IGCalendarView 

          • New view added: WeekView
          • Added the ability to style and set working hours.

          IGFlowLayoutView 

          New Maximize Item support

          IGCalendarView

          Smart Axis has gotten even better, by supporting text wrapping.  

          Wrapping it Up

          That's it for iOS & Android for 15.2.  We are excited to get these enhanncements and improvements in your hands, and we are committed to continuing to deliver features and functionality to help you build the absolute best modern, native mobile apps.  If you have any questions, shoot me an email at jasonb@infragistics.com, and if you'd like to see features that we don't have yet, please post to User Voice and let us know!


          What's New in Windows Forms 15.2!

          $
          0
          0

          With more than 100+ controls, Infragistics Windows Forms is the most mature, fully-featured Windows Forms Product on the market. With features that cover every aspect of enterprise software development including Microsoft Office Style user interfaces, high performance charting, and full modern experiences with touch & gestures. With this release, you will see our continued commitment and investment in Windows Forms, we recognize that it is by far the most widely used .NET platform for enterprise scale apps that target the desktop. Our goals and themes remain the same for the Ultimate toolset, and Windows Forms is a major part of this story:

          • Touch Everywhere, Office Inspired Apps on Every Platform
          • Deliver Outstanding Experiences with Awesome Branding and Styling
          • Developer Productivity Across Every Device, Every Platform

          Overall, we had an emphasis on quality for 15.2, which means improving existing features, RTM'ing features that were previously CTP, and polishing your developer experience using the product.

          I'll highlight each area of focus for 15.2.

          ToolbarsManager Improvements

          Notification Badges

          This is a cool new feature that is common in mobile apps for notifications ... now you can do the same in your Windows Forms apps. The goals are:

          • To be notified via noticeable means for time-sensitive matters that require my attention
          • To clearly see how many new items need my attention
          • That when I click on the tool item with the notification, I expect to be shown/taken to the items that require my attention and (if applicable) to be able to interact with those items/events.
          • That once I’ve checked the items/events I was notified for, there will no longer be a notification calling for my attention (until the next event that I should pay attention to)


          DataChart Improvements

          We've added a few enhancements to the Charts:

          • SaveTo (ImageType) – BMP, EMF, EXIF, GIF, GUID, ICON, JPEG, MemoryBmp, PNG, TIFF, WMF
          • Gallery Stacked Series
          • Legend Types
          • Value Overlay

            Axis Intervals - Major/Minor Gridlines

            • Annotation Layers
              • Category Tooltip Layer

                  • Item Tooltip Layer

                  • Crosshair Layer

                  • Category Highlight Layer

                  • Category Item Highlight Layer

                • Bubble Series

                  • Stacked Series
                  • Polar Series

                  • Radial Series

                • Gesture / Touch Support
                  • Pinch and Zoom, Pan, Press & Hold
                • Scale Legend
                  • Support for the BubbleSeries to visualize the correspondence between bubble size and color

                CTP Controls - Excel Spreadsheet

                The goal of every app seems to be delivering more Excel-like features to your customers. We included a Spreadsheet control in WPF last year, and this year we've focused on doing the same in Windows Forms. This release is labeled a CTP, but it has a ton of great features and samples. Take a spin with this exciting new control and let us know what you think!

                • Cell Formatting
                  • Number formats
                  • Horizontal Alignments – General, Left, Center, Right, Fill, Justify, Center Across Selection, Distributed
                  • Vertical Alignments – Top, Center, Bottom, Justified, Distributed
                  • Wrap Text
                  • Shrink To Fit
                  • Indent
                  • Fonts – All font settings except double underline and accounting*
                  • All Border styles
                  • All Fills styles
                  • Mixed Format/Formatted Text
                • Merged Cells
                • Undo/Redo
                • Resizing/Hiding Rows/Columns
                • Insert/Delete Rows/Columns/Cells
                • Split & Frozen Panes
                • Formula Bar w/ Name box
                • Cut/Copy/Paste
                • Edit support
                  • Update active cell or entire selection
                  • Enter formulas (including array formulas)
                  • Infers number format based on entry
                  • Fixed decimal support
                • Excel style keyboard navigation
                  • Arrow keys
                  • Enter key
                  • End mode
                  • Selection modes – normal, extended, add to selection
                  • Scroll lock support
                • Zoom support
                • Worksheet tabs with multiple tab selection
                • Hyperlinks
                • Data Validations
                • Worksheet image background
                • Context Menus

                Since the new Spreadsheet control includes the FormattedTextEditor, it gets the new SubScript and SuperScript capabilities that were needed for the Spreadsheet control.

                Styling Improvements

                To give a modern Office look, we've included new Style Libraries for all Windows Forms controls.

                Outlook Blue

                • Outlook2013 - Dark Gray.isl
                • Outlook2013 - LightGray.isl
                • Outlook2013 - White.isl

                Excel Green

                • Excel2013 - White.isl
                • Excel2013 - Dark Gray.isl
                • Excel2013 - Light Gray.isl

                Ease of Use for Office Inspired Apps

                We've added a few smaller features to further enhance your Office-inspired apps:

                • FormattedTextEditor - Superscript and Subscript support - The FormattedTextEditor will be used as part of the new UltraSpreadsheet control so it will need to support certain features that the xamSpreadsheet and Excel support. This will included Subscript and Superscript.
                • PivotGrid - Simplified Binding - The FlatDataSource class provides a way for the developer to show “non-OLAP” data in the PivotGrid control, we anticipate this to be the primary means by which the developer will display data in the PivotGrid control. The objective for this feature is to make it easier to connect the PivotGrid control to a database table
                • WinGrid - Summary Rows Height - the summary rows may now have either smaller or larger height than the one need to fit their content, which was previously always used.
                • MessageBoxManager - Window Location

                Wrapping it Up ....

                That’s it for this Windows Forms 15.2 release. As you can see, we are still making big investments in Windows Forms - this platform is still driving the Enterprise mission critical apps today and our goals are to deliver the support you need in updating and maintaining these applications as you look at newer, modern platforms for future enterprise development. If you have any questions, shoot me an email at jasonb@infragistics.com, and if you have any ideas for the product or don’t see a feature that you’d like, let us know at the User Voice site!

                Infragistics Silverlight Release Notes – October: 15.2 Volume Release

                $
                0
                0

                Release notes reflect the state of resolved bugs and new additions from the previous release. You will find these notes useful to help determine the resolution of existing issues from a past release and as a means of determining where to test your applications when upgrading from one version to the next.

                Release notes are available in PDF, Excel and Word formats. The PDF summarizes the changes to this release along with a listing of each item. The Excel sheet includes each change item and makes it easy for you to sort, filter and otherwise manipulate the data to your liking.

                In order to download release notes, use the following links:

                Silverlight 2015 Volume 2 Release (Build 15.2.20152.1000)

                Notes in PDF Format
                Notes in Excel Format
                Notes in Word Format

                Infragistics WPF Release Notes – October: 15.2 Volume Release

                $
                0
                0

                Release notes reflect the state of resolved bugs and new additions from the previous release. You will find these notes useful to help determine the resolution of existing issues from a past release and as a means of determining where to test your applications when upgrading from one version to the next.

                Release notes are available in PDF, Excel and Word formats. The PDF summarizes the changes to this release along with a listing of each item. The Excel sheet includes each change item and makes it easy for you to sort, filter and otherwise manipulate the data to your liking.

                In order to download release notes, use the following links:

                WPF 2015 Volume 2 Release (Build 15.2.20152.1000)

                Notes in PDF Format
                Notes in Excel Format
                Notes in Word Format


                Your Old Language Version is Costing You Money

                $
                0
                0


                Imagine that you walk into a company, and take a stroll through the software department.  All around you, as far as the eye can see, developers toil away, staring into 17 inch CRT monitors.  What would you think of that?  Would you have to restrain yourself from jogging over to the HR department, enthusiastically, to apply for a job?  Or would you thank your lucky stars that you worked somewhere else?  I’m betting the latter.

                One of the most penny wise, pound foolish strategies that a company can pursue is hiring a team of software developers, whose mean salary may be in the six figure range, and saving a few bucks by forcing them to do their work on obsolete hardware.  It’s foolish because the productivity lost by these expensive workers far outpaces the cost of updated computers and monitors.  Of course, this is pretty commonly known these days.  You don’t see or hear about nearly as many companies skimping too much on a second monitor or new machines for software developers.

                And yet, it’s still fairly common to make developers use older versions of programming languages and frameworks.  Now, this isn’t a completely direct parallel.  Companies historically have let hardware age on developers’ desks mainly as a cost savings strategy, whereas continuing to work on a “stable” version of a language or framework is generally a risk minimization strategy; why port your code base to v-next when that could introduce bugs and it doesn’t matter to the users?  That’s a fair argument, but the thing is, when you pull back a level of abstraction, risk minimizing is, at its core, still about cost savings.  In a company, everything comes down to top line revenue minus bottom line cost.

                So why would I argue that it makes sense to upgrade to v-next, taking the risk and possibly incurring the cost associated therewith?  Well, instead of answering that directly, how about I show you?  Take a look at the following code that you might find in some kind of .NET based, online dating application.

                1

                2

                3

                4

                5

                6

                7

                8

                9

                10

                11

                12

                13

                public class GeographicRegion

                {

                    private readonly IEnumerable<DatingProfile> _profilesInRegion;


                    public GeographicRegion(IEnumerable<DatingProfile> profilesInRegion)

                    {

                        _profilesInRegion = profilesInRegion;

                    }

                    public IEnumerable<DatingProfile> FindActiveTwentySomethings()

                    {

                        return _profilesInRegion.Where(profile => profile.Age >= 20 && profile.Age < 30 && profile.IsActive);

                    }

                }

                Nothing too remarkable. There’s a concept of “Geographic Region” and each region is handed, upon instantiation, a strategy for enumerating profiles found within it. It has a method called FindActiveTwentySomethings() that, unsurprisingly, looks for anyone with an age in the 20s and a setting on the profile indicating that the profile is active. Apart from a potential discussion of which sort of collection type might make the most sense, there’s absolutely nothing remarkable happening here. This code is so simple that it’s almost not worth discussing.

                But let’s go way, way back in time and look at what someone might have written in the days of Visual Studio 2003.

                1

                2

                3

                4

                5

                6

                7

                8

                9

                10

                11

                12

                13

                14

                15

                16

                17

                18

                19

                20

                21

                public class GeographicRegion

                {

                    private readonly DatingProfile[] _profilesInRegion;


                    public GeographicRegion(DatingProfile[] profilesInRegion)

                    {

                        _profilesInRegion = profilesInRegion;

                    }

                    public IEnumerable FindActiveTwentySomethings()

                    {

                        ArrayList matchingProfiles = new ArrayList();


                        foreach(DatingProfile profile in _profilesInRegion)

                        {

                            if (profile.Age > 20 && profile.Age < 30 && profile.IsActive)

                                matchingProfiles.Add(profile);

                        }


                        return matchingProfiles;

                    }

                }


                The first thing you’ll notice is that the code is longer, but not horribly so. The second thing that you’ll probably notice is that the FindActiveTwentySomethings() method is not only longer, but it’s also no longer declarative, but, instead, imperative. The code no longer says, “give me profiles where the age is in the 20s and the profile is active.” Instead it says, “first, declare an array list; next, loop through the items in the profiles and for each of those items, do the following… etc.” Finally and perhaps most subtly, the lack of generics (those came with C# 2.0 in 2005) means that the method no longer forces type safety. ArrayList and IEnumerable here both deal in Object. This doesn’t seem to be an immediate problem here, since the dating profile is strongly typed, but if you’re a caller of this method, that’s hardly reassuring.

                None of these things seems like a big deal in this small context, but imagine this start difference, writ large across an entire code base, application ecosystem or software department. The C# 1.1 code shown above is more verbose, harder to read, harder to work with, and more error prone during maintenance. This means that developers in such a code base spend more time floundering, troubleshooting, squinting to try to understand, and generally wasting time (and money) than their counterparts working in a modern code base.

                Over the course of time, language and framework authors, like any software vendors, address shortcomings in their products and add features that make things easier and more efficient for their users. So, every time a new version of a language comes out, you can expect development in that language to trend toward more efficiency. As a company or a department, if you deliberately avoid such updates, it’s no different than not updating hardware as it ages. Your team’s productivity (and morale) will suffer.

                It’s not common for companies to be penny wise and pound foolish about hardware any longer. So, don’t make the same mistake with your software. Have a plan to stay on the latest bits and keep your developers operating at peak efficiency. You don’t have to adopt everything that comes out right away, but you can’t afford to let it go too long.


                Infragistics Ultimate 15.2 is here. Download and see its power in action!


                What Kind of Money Do Developers Make? (Infographic)

                $
                0
                0

                If you're interested in what developers of different types are earningright now, take a peek at this Infographic! We've checked out almost all of the relevant sites and wrapped together a ton of data for you so check it out!

                Share With The Code Below!

                <a href="http://www.infragistics.com/products/aspnet><img src=" http://www.infragistics.com/community/cfs-filesystemfile.ashx/__key/CommunityServer.Blogs.Components.WeblogFiles/d-coding/8838.Developer_5F00_Salaries.jpg "/> </a><br /><br /><br />Developer Salaries <a href="http://www.infragistics.com/products/aspnet">Infragistics ASP.NET Controls</a>

                Six Shocking Facts about Enterprise Mobile Security and How to Avoid Them

                $
                0
                0

                A lack of mobility in today’s market could harm a business in many ways. Not being mobile might lead it to miss out on consumer solutions or result in missed business opportunities. As a result, enterprise mobility has become a must-have for modern organizations, delivering many successes and opportunities. Yet despite the advantages of mobility, security threats are fast evolving through malware sophistication and targeting and pose a real threat to your company’s security.

                In this post, we want to highlight a few facts about enterprise mobile security and how organizations who want to embrace enterprise mobility can go about avoiding the associated threats.

                Mobile Devices & Threats

                According to research by the Enterprise Strategy Group, enterprise mobility technology spending plans for the next 12 months show an 18% increase in BYOD initiatives and a 19% increase in mobile applications deployment. For Q3 2014, Android OS achieved a worldwide Smartphone market share of over 84%, a remarkable increase from 17.2% in 2010. Equally there has been a huge growth in Android malware, with about 99% of all mobile malware detected by Kaspersky Lab in 2012 designed to attack Android devices.

                In 2014 alone, about 81% of organizations suffered a data loss incident and new malware increased by 71%; a clear message about cybercrime reaching a critical point. A 2015 global study by Check Point shows that 59% of organizations with a BYOD policy are faced with the problem of tracking/controlling access to corporate and private networks, while 46% are faced with the challenge of keeping device OS and apps updated.

                The Changing Mobile Landscape

                We want to highlight six areas where organizations can make more effort in managing exposure to the various security threats that come with enterprise mobility, becoming proactive in preventing vulnerability.

                1. Mobile Endpoints

                The current use ofenterprise mobile endpoints for Android (66%), Apple (77%) and Windows (33%) is set to significantly rise (by 20% for Android, 10% for Apple and 30% for Windows). Organizations can better manage their growing mobile device fleet by setting and maintaining security policies, protecting information on devices, and by applying authentication to both networks and applications.

                2. Device-Level Security

                Respondents of a Ponemon mobile security survey indicated lax attitudes tomobile security. While 77% of people viewed mobile technology as essential and 76% thought mobile usage could negatively impact security, only 39% had mobile security measures in place. Better identity and access management systems for tracking user account changes and the ability to establish patterns and define normal activity are some of the ways in which organizations can successfully mitigate the risk of device-level data breach.

                3. Mobile Applications

                With a basic security test fail rate of over 75% for mobile apps due to a number of factors ranging from lack ofproper encryption to the number of weekly attacks on mobile apps, it is no surprise that mobile device breaches are hitting companies very hard. Organizations must first educate their employees about the risks associated with mobile applications, then standardize on trusted enterprise-grade applications, implement category-based applications management processes and encrypt documents to prevent data loss.

                4. Cyber Security Strategy

                According to Cisco’s 2015 Annual Security Report, acyber security benchmark showed that while 90% of respondents were confident in their security capabilities, a full 60% were not patching software and systems. Organizations must build on the following security principles: security must support the business, work with existing architecture and be usable, be transparent and informative, enable visibility and appropriate action and, finally, must be viewed as a people problem.

                5. App Stores & Developers

                Mobile apps can easily copy personal details, GPS coordinates or details of all apps installed on a device andupload them. Organizations now face high-riskapplication events as many as 305 times per day - up 88% from last year’s rate of 162 times per day - as a direct consequence of downloaded apps. Organizations therefore need to implement a software-defined protection architecture and combine OS and CPU level sandboxing with threat extraction technologies to mitigate against fast-evolving attacks from app store and/or developer vulnerabilities.

                6. Wipe Data

                IBM’sMaaS360 analytics gathered from global IT organizations indicate that on average, 450 devices get wiped in a day, with 51% using manual wipe and only 37% doing a full wipe. Improved containerization capabilities are essential for organizations to be able to isolate work data, making it easier to perform selective wipes or even repurpose a device previously used by another employee.

                Secure the Future

                Organizations must be future minded, setting clear long term objectives on how to optimize security infrastructure, tools and technologies in order to be prepared for the ever increasing vulnerabilities and threats resulting from the changing mobile landscape. By understanding both potential and unknown cyber security threats, utilizing the expertise of information security professionals and creating solid plans that align with your business, you can turn security into an enabler and fully reap the benefits of the mobile enterprise.

                Have you already tried Infragistics SharePlus, our native mobile SharePoint solution? SharePlus is amazingly easy to adopt and loved by users working with SharePoint on the go. Sign up for a SharePlus Enterprise demo today.

                What’s New in Infragistics WPF 15.2

                $
                0
                0

                Infragistics WPF 15.2 is your release!  That’s right… your release.  My job as a Product Manager here at Infragistics is to give you, our customers, a voice.  I listen to your feedback, both positive and negative, and make sure our products reflect those conversations.  For years, Infragistics has been working on building a community with you, with honest and transparent communication.  It took some time, but you have finally discovered your voice.  You have been empowered by your voice.  Now, you have directly influenced the products you use with your voice.  Every single feature that we are delivering with our Infragistics WPF 15.2 release was requested and/or influenced directly by you.  We don’t have a single feature with any corporate strategy, agenda, or market influence.  This release is all about you, our customers.

                Ask and thou shall receive! Let’s check out all the controls and features you ask for, and that we delivered in our 15.2 release.

                xamBusyIndicator

                Back in 2010, I started an OSS project called the Extended WPF Toolkit.  You may have hear of it.  The very first control in it was a busy indicator control.  Over the years, I added many more controls to the toolkit, but the busy indicator was always one of the most popular controls in the toolkit, and for good reason.  Every single WPF application I ever wrote had the need for a busy indicator control, and I am confident you have had a similar experience. Surprisingly, this is a control that has been missing from the Infragistics WPF offering for a long time.  Well, not anymore.  Thanks to you, we now have the best busy indicator control on the market.  Period.

                For those of you that may not be familiar with a busy indicator control, it’s a control that makes it easy for a developer to report the progress of a long running, multi-threaded, process to their end-users.  It shows a dialog on top of an area of a view in which an animation will play to give the end-user visual feedback on the progress of an operation, while locking out the underlying view elements with a slightly transparent overlay.

                xamBusyIndicator

                Showing the xamBusyIndicator is as simple as setting the IsBusyproperty to true when a long running process is about to start.  To close it, set the IsBusy property back to false when the operation has completed.

                The xamBusyIndicator supports both determinate and indeterminate states.  For indeterminate states, set the IsIndeterminate property to true, and a continuous animation will play until the operation has competed.  This is common for scenarios of when the time to complete an operation is unknown.  For determinate states, the developer can update the ProgressValueproperty in order to increment animation values to give the end-user visual feedback of the exact percentage complete of the operation.

                The xamBusyIndicator ships with eight built-in animations (seven shown below) which can be changed using the Animationproperty.  Developers can also provide their own animation via a DataTemplate. Keep in mind that some animations only support the indeterminate mode regardless of the value of the IsIndeterminate property.

                xamBusyIndicator animations

                As with most busy indicator controls, the xamBusyIndicator also support the use of custom BusyContent, and the ability to delay the appearance of the indicator with the DisplayAfter property.  Another cool feature is the ability to set focus to any control in the view using the FocusAfterproperty, so when the xamBusyIndicator is closed, focus can be set on an element like a TextBox for a better end-user experience.

                Another really cool thing we added for the xamBusyIndicator was actually to the WPF Sample Browser.  We added a cool configurator so that you can customize the xamBusyIndicator and then export the style for use in your application.  This way, you don’t have to write any code.  Just get the xamBusyIndicator just like you want it, export the style to the clipboard, and then paste into your application.  It’s that easy!

                xamBusyIndicator configurator

                xamDataGrid

                Prior to 15.2, the xamDataGrid only provided the Excel style multi-select filtering option if the grid was using the FilterUIType of LabelIcons.  As you can imagine, that Excel style filtering is a very popular style of filtering, and we know how annoyed you were with this fitering option not being available with the FilterRecord option.  So we fixed it!  You can now provide this familiar Excel style filtering to your end users when using FilterRecord as the FilterUIType by setting the FilterOperandUIType to ExcelStyle.

                xamDataGrid excel filtering

                If you’re an MVVM developer, which if you are doing WPF you better be, then you are well aware of the INotifyDataErrorInfo interface.  Now, the INotifyDataErrorInfo interface is different than the IDataErrorInfo that is available in earlier versions of WPF.  INotifyDataErrorInfo was released with .NET 4.5 and is the new recommended interface to use for reporting error information both synchronously and asynchronously.  As you may have guessed by now, the xamDataGrid fully supports the INotifyDataErrorInfo interface.

                Along those same lines, if you are doing MVVM, then you know all about the INotifyPropertyChanged interface.  But, what happens if your objects don’t implement INPC?  What can be done?  Well, there are a number of design patterns you could follow to add support for INPC.  Or, you can just use one of the two new methods we added to the xamDataGrids Record called RefreshCellValue and RefreshCellValues.  These new methods allow you to manually refresh the data that has been displayed to your users without the need for the INotifyPropertyChanged interface.

                When we announced the release of the new TemplateField for the xamDataGrid, we had tons of great feedback and praise.  We also had a very common request.  As of the 15.2 release, you can now use a DataTempateSelector to utilize business logic to determine which template to apply for both the EditTemplate and DisplayTemplate.  Simply create a DataTemplateSelector class, add your logic, and then set the EditTemplateSelector and/or DisplayTemplateSelector properties.

                The last feature we added to the xamDataGrid for 15.2 is a handy new event called DataSourceChanged.  This will allow you to respond any time the data source of the xamDataGrid has been changed.

                xamPropertyGrid

                For those customers wanting more control over the sorting of properties and categories in the xamPropertyGrid, wait no more.  We have introduced a number of new attributes and properties to the xamPropertyGrid to give you complete control over how the properties and categories are sorted.  For property sorting, simply decorate each property in a class with the PropertySortOrderAttribute and provide an integer to designate the desired order of the property.  For example; decorating a property with the following attribute would sort the property into the 5th position in the XamPropertyGrid display:

                [PropertySortOrder(5)]

                In order to set the sort order of categories, you need only to decorate the class with the CategorySortOrderAttributeand provide the name of the category to sort, as well as an integer to represent the desired order of the category as it will be shown in the xamPropertyGrid. You can declare multiple CategorySortOrderAttributes on a class to represent each category you have defined.  For example; the following attributes on a class would assign sort orders for 3 categories used by the properties in the class which would appear in the xamPropertyGrid in the order of “Touch”, “Behavior”, and “Appearance”:

                [CategorySortOrder(“Appearance”, 5)]
                [CategorySortOrder(“Behavior”, 4)]
                [CategorySortOrder(“Touch”, 1)]

                But Brian… what if my business object libraries can’t reference the Infragistics WPF assemblies?  Great question!  If the classes that contain the properties to be displayed in the XamPropertyGrid are contained in an assembly that doesn’t, or can’t, have a reference on the XamPropertyGrid and therefore doesn’t have access to the two custom attributes described above, we support an alternative approach where you can decorate your classes/properties with custom attributes that you define in your own assembly. The XamPropertyGrid will recognize these developer-defined custom sort attributes as long as they conform to the following 2 rules:

                The developer defined attribute names must be:

                • CategorySortOrder (or CategorySortOrderAttribute)
                • PropertySortOrder (or PropertySortOrderAttribute)

                And each must take parameters of the following types:

                • CategorySortOrder must take 2 parameters: one of type string for the category name and one of type int for the sort order
                • PropertySortOrder must take 1 parameter of type int for the sort order

                But Brian… My objects are closed for modification, or I don’t have the access to modify the classes directly.  So I can’t even use my own custom attributes, even if I wanted to.  Now what?  No problem!  If you cannot, or prefer not to, take a declarative approach and decorate the types/properties with attributes, we provide a programmatic way for you to control the sort order. We do this by exposing two settable properties on the XamPropertyGrid of type IComparer:

                • public IComparerCategorySortComparer
                • public IComparer PropertySortComparer

                Another feature asked for by customers was the ability to support the System.ComponentModel.MergablePropertyAttribute to give you control on how properties are edited when they exist on an object instance that is part of a multiple selection in the xamPropertyGrid.  When a property is decorated with the MergableProperty, the decorated property is hidden from the xamPropertyGrid and will not be available for editing.

                Lastly, support for the System.ComponentModel.ICustomTypeDescriptor interface has been added to give you more control on how properties are displayed in the xamPropertyGrid by providing dynamic custom type information.

                xamPropertyGrid ICustomTypeDescriptor support

                xamComboEditor

                The xamComboEditor now has support for the System.ComponentModel.DescriptionAttribute so that when binding the xamComboEditor to an items source that is an Enum, whether as a standalone editor or as an editor in the xamDataGrid, it will display the descriptions declared via the attribute rather than the actual Enum values.  This is one of those small, but very help and much needed features.

                xamComboEditor DecriptionAttribute support

                Legends

                We made improvements to the API of the the Legend, ItemLegend, and ScaleLegend by exposing a number of new properties so that you can more easily change the appearance of the items that appear in the legends.

                • TitleForeground
                • TitleFontSize
                • TitleFontFamily
                • TitleFontStyle
                • TitleFontWeight
                • TitleFontStretch
                • ItemsForeground
                • ItemsFontSize
                • ItemsFontFamily
                • ItemsFontStyle
                • ItemsFontWeight
                • ItemsFontStretch

                In addition, there are four new properties of positioning/aligning title and items within legends:

                • TitleHorizontalAlignment
                • TitleVerticalAlignment
                • ItemsHorizontalAlignment (not apply to ScaleLegend)
                • ItemsVerticalAlignment (not apply to ScaleLegend)

                Note:  These new properties do not affect the legacy theme for the xamDataChart because the base class of the legend controls use different properties in this theme.

                xamDataChart

                New properties have been added to the xamDataChart that allows the developer to more easily set a major and minor gridline interval. This eliminates the need for you to create custom code to recompute the interval values each and every time the end-user zooms, scrolls, or when new data is added to the chart.

                xamSpreadsheet

                The xamSpreadsheet now has support for data validation.  You can now validate cell values, provide tooltips, and show error messages based on invalid values.

                xamSpreadSheet data validation

                Excel Engine

                Our popular Excel engine, the engine that powers our xamSpreadsheet control, has added four new methods to its API.  These methods make it much easier to insert and delete rows and columns from the WorksheetTable class.

                • DeleteColumns(int tableColumnIndex, int count = 1)
                • DeleteDataRows(int dataRowIndex, int coun = 1)
                • InsertColumns(int tableColumnIndex, int count = 1)
                • InsertDataRows(int dataRowIndex, int coun = 1)

                xamRichTextEditor

                The xamRichTextEditor received a new method called GetPositionFromPointwhich enables a customer to get the nearest valid text insertion location relative to the supplied point. The method name and parameters match the name/parameters used by the WPF RichTextBox so that customers can easily discover this new method and be familiar with how it should work.

                Let’s Wrap this Baby Up!

                Besides the new xamBusyIndicator control, and all the new features I mentioned in this post, we are delivering much more that I didn’t get a chance to talk about.  We have tons of other smaller features, and bug fixes, and performance optimizations that are part of our newest 15.2 release.

                I hope you are as excited about this release as I am.  As you have probably noticed, things are changing at Infragistics, and your voice is louder than ever.  If you have ideas about new features we should bring to our controls, important issues we need to fix, or even brand new controls you’d like us to introduce, please let us know by posting them on our Product Ideas website.  Follow and engage with us on Twitter via @infragistics. You can also follow and contact me directly on Twitter at @brianlagunas.  Also make sure to connect with our various teams via our Community Forumswhere you can interact with Infragistics engineers and other customers.

                If you are not using our WPF controls yet, remember that a free evaluation download is only a click away.

                Lastly, when you do build something cool with our controls, please make sure to let us know.

                What's New in 15.2? Webinar Recap

                $
                0
                0

                Infragistics Ultimate 15.2 is here, and you're going to love it! We’ve been hard at work updating our products to help you build apps with the features your customers have been asking for, so check out our launch webinar and get exclusive access to the latest news from Infragistics, including:

                • a look at what's new through great demos that show the value you can deliver across desktop, web & mobile apps;
                • a deep dive into new rapid prototyping features in Indigo Studio;
                • a sneak peek into what you can expect in the next few months from Infragistics, and more!

                Don’t miss out: download your free trial of Infragistics Ultimate 15.2 and view the webinar recording here!

                [youtube] width="560" height="315" src="http://www.youtube.com/embed/OUI8EzfY-RY" [/youtube]

                Potential error while using Windows 10 64-bit's "Apps & Features" interface to uninstall lnfragistics Ultimate products

                $
                0
                0

                Windows 10 has provided a new way on how you can uninstall programs from your system. The built-in “Settings” application has a “System” option where you can view “Apps & Features”.  This will list applications installed on your system and provide an easy way to uninstall them.

                Uninstalling a product via Apps & Features

                If you attempt to uninstall an Infragistics product via “Apps & Features”, you might experience an error.  This may be due to, at the time of this posting, an issue in the tooling used to create the installation as explained at http://wixtoolset.org/issues/4857/.  This issue, so far, has only been seen on Windows 10 64-bit machines. 

                While we have seen this error during testing, we have not been able to reproduce it consistently on every Windows 10 64-bit machine.  If you do happen to experience this error in your environment, the products can still be uninstalled successfully on Windows 10 via one of these options.

                Option 1– Use the “Programs and Features” option in “Control Panel” and choose the "Uninstall" option for the product.

                Option 2 - Run the Infragistics Platform Installer that you used to install the product initially.  It can also be used to modify, repair, or uninstall the product.

                Option 3– If you still have the .MSI file for the product you want to remove, run it and choose the “Remove” option.

                From Data to Decisions: How Do You Make Decisions?

                $
                0
                0

                What was the best decision you ever made? Was it when you chose the University you’d study at? Was it the time you decided to change your career? Was it when you threw caution to wind and took that month long vacation?

                The decisions we take can change our lives. Of course, not every decision will have an enormous impact on your long term happiness or success (Indian takeaway or Chinese takeaway?). However, the way we actually make decisions – whether it’s in our personal lives or at work – is largely similar. The thing you’re deciding on could be enormous or insignificant, but the process of reaching a decision can often be almost identical.

                The issue is that our decision making process excels for certain types of choices – the kinds of things that kept our ancestors alive and kicking. However, the modern world, and especially the world of work, asks us to make a lot of complex decisions which require rational thinking and to leave our ‘gut instinct’ aside. While ‘intuition’ still has a lot of currency in the world of work, it’s also important to consider a wide range of facts – especially when large sums of money and other peoples’ livelihoods are involved.

                Business Intelligence is key to forming the best decisions and in today’s post we’ll look at how you can tap into your organization’s data to make the best decisions.

                How do you arrive at decisions?

                The vast majority of our decisions are made using heuristics. Heur-what-stics? Heuristics is, basically, a hard to pronounce word which describes how we make decisions by reducing complexity in the world around us.

                Your mind is very good at making associations between things in the world around us, combining these with our experience, and helping us make decisions on the back of this. Heuristics is useful because it saves us a lot of time. We can think of the brain as a filter, constantly cutting out the noise and helping us focus on what’s important. If we didn’t have this capability, we’d basically never make any decisions about anything. Let’s illustrate this with a quick example.

                You need some new pants and are walking through a mall in the city center on your lunch break. On arriving at the mall you look at the floor plan. You find a department store; once there you follow the sign to the men’s clothing department (assuming you’re a dude). Although there are lots of jeans available, you haven’t got a lot of time, so instantly pick a pair made by a well-known brand.

                Heuristics helps you navigate this situation quickly and effectively. There were probably plenty of pants-selling stores you could have visited in the mall, but you chose the department store unconsciously because you knew you’d find what you were looking for there easily. When you chose the well-known jeans brand, heuristics came into play again. You associated it with quality, paying more on trust that the designers know what they’re doing.

                In both these situations, you could have spent a long time analyzing every single option. You could have visited every store in the mall trying out their stock. You could have compared all the jeans in the department store, examining how they were stitched, testing the strength of the rivets on the pockets. But, you would get nowhere in life if you took this approach to everything. Heuristics helps you make decisions fast.

                However, not all decisions are made heuristically. Daniel Kahnemann, Nobel Prize winning  cognitive psychologist and author of Thinking, Fast and Slow describes two different types of thought. One is our quick, heuristic thinking. The other is slow, deliberate and logical.

                So, what’s this got to do with Business Intelligence?

                The decisions we make in the workplace should combine the two kinds of thinking humans are capable of. In high pressure situations, you can’t spend hours dithering about which course to follow. Nonetheless, this isn’t always the most appropriate method. Heuristics is, inevitably, based on past experience, prejudice and unconscious ‘instinct’. This can be useful in some case, yet in others it will hold you back. 

                For example, if you’re deciding to expand operations into a new market, this isn’t the kind of thing that should be done on a whim. You need to be sure there’s actually a market for your product, that you have the resources to set up new offices and hire new people. If this kind of decision isn’t made with solid facts backing it up, you risk making major blunders. Yet, as the graph below shows, a lot of decision makers keep making choices based on heuristic methods:

                Research: Which of the following best describes your personal approach to making significant management decisions?

                Source: Economist Insights

                Business Intelligence can help decision makers avoid making major decisions ‘on a whim’. Tools like ReportPlus from Infragistics allow any decision maker to draw their organization’s data into easy to use, interactive dashboards on a touchscreen device. This allows rapid access to hard facts and means fewer decisions are based on instinct and more decisions are based on logical and deliberate thinking.

                ReportPlus is available on iOS, Android and will soon be released for desktop. Try ReportPlus free on iOS today. It might be the best decision you ever make.  


                Who Are the World's SharePoint Experts?

                $
                0
                0

                It’s not often we start a post like this, but, be prepared for disappointment: Gregory Hartley and Maryann Karinch claimed a couple of years back that you can become an expert in anything in just two hours. Does this mean you’ve been wasting your time attending SharePoint webinars, joining community forums, and reading blogs like...ours? We’re not convinced.

                Mastering SharePoint takes years of dedication, building relationships and countless hours devoted to the product to reach anything close to expert status. Experts not only know SharePoint inside out, they also use their knowledge to contribute, to give back to the community and help all of us get more out of our communications and collaboration platform. Today we wanted to give a high five to those influential folks whose in-depth knowledge gives so much back to the community.

                Expert ease

                So, how exactly do you define an expert? Is it the individual who has made the most money? The person with the most expansive knowledge or the best public speaking skills? It’s impossible to judge, for the most part due to the word ‘expert’ being a comparative term. Perhaps that is the reason why so many profess to being an expert themselves.

                And true, while there are many great influencers and people championing and providing a wealth of advice around SharePoint, there are that special few who have really driven the success of Microsoft’s platform and we think we’ve found them. So without further ado, here’s our list of SharePoint experts!

                Jeff Teper

                The Corporate Vice President of OneDrive & SharePoint at Microsoft, Jeff Teper was one of the minds behind bringing someone called Satya Nadella into the company all the way back in 1992 - a move which some would say has paid off.

                Often working under the alias of “The Father of SharePoint”, Jeff was one of the Foundations Knowledge Management team that later went on to develop and create the business collaboration platform. In 2011 he identified cloud computing as the most important technology of the year, and four years down the line we can see that he wasn’t wrong. It’s clear that Jeff and Satya have similar aspirations for the company, and his close relationship with the CEO combined with his hand in the creation of SharePoint meant there wasn’t really any way Jeff couldn’t appear on this list.

                Julia White

                Julia White is the general manager of the Microsoft Office division, which oversees SharePoint. A 13-year veteran of the company, she was caught in the firing line somewhat earlier this year at Ignite, where rumors spread about the neglect of the on-premises SP2016, forcing her to assure that SharePoint Server ‘16 was not being disregarded. She also wrote this article on “The Evolution of SharePoint” for the Office blog back in February.

                What’s more, Julia has been praised for her laid-back attitude, whilst still possessing all the customary fiery traits of a businesswoman at the top of her game. She’s also been labelled “the first cool Microsoft employee in potentially forever”. Not a bad title to have!

                Mary Jo Foley

                A Microsoft journalism giant, Mary Jo Foley has been in-the-know with everything Microsoft for the past 30+ years, going all the way back to 1983. She continues to write freelance for a number of tech publications, and authored the book“Microsoft 2.0: How Microsoft Plans to Stay Relevant in the Post-Gates Era” which received widespread critical acclaim. With further successes in podcasting and news editing, it’s fair to say she knows her way around Microsoft in the press. Her ZDNet blog contains all the latest releases on everything Microsoft.

                Being so involved in the Microsoft world, Mary is always the first in line when it comes to product releases, updates and everything in-between, including SharePoint.

                Follow her on Twitter for rolling updates on the world of Microsoft (and occasionally craft beer!)

                Naomi Moneypenny

                Naomi is the Chief Technology Officer at Synxi, where she leads the development team for the adaptive recommendations and machine learning engine for SharePoint. A thoroughly active member of the SharePoint community, she was named a Top 25 SharePoint Influencer in 2014 and more recently grabbed the number one spot on the Top 25 Office 365 Influencers.

                Her blog is filled to the brim with articles exploring enterprise social and collaboration, innovation, trend forecasting and of course, SharePoint. You can also view a list of events where Naomi is speaking around the world.

                That’s a wrap!

                As always with these types of posts, there are many more people we could have included. However, we’d like to think there’s not much room for dispute on whether or not the above deserved a place on our list. They’ve all spent a significant part of their working lives dedicated to the world of SharePoint and Microsoft, and have reaped the well-deserved rewards. Then again, maybe the true root to their success is that they all read “How to become an expert in anything in 2 hours”. We’d have to ask them!

                You don't need to be a SharePoint expert in order to mobilize your corporate SharePoint! Check out Infragistics' SharePlus' demo: the ultimate mobile productivity solution for SharePoint and Office 365.

                How to create relationships between entities in the Entity Framework Code First Approach

                $
                0
                0


                The Entity Framework Code First approach allows us to create a model as a plain class and then the database gets created from the domain model or entity class. In the Code First approach, the database gets created from the classes.

                Some advantages of the Entity Framework Code First approach include (as stated in Scott Gu’s blog):

                        Developing without ever having to open a designer or define an XML mapping file

                        Defining your model objects by simply writing “plain old classes” with no base classes required

                        Using a “convention over configuration” approach that enables database persistence without explicitly configuring anything

                        Optionally overriding the convention-based persistence and using a fluent code API to fully customize the persistence mapping


                Rather the delving more into theoretical concepts, in this post we will directly jump into code and create a table and database using the Code First approach. In this post we will learn how we can create entities and a relationship between entities in the Entity Framework Code First approach. In the EF Code First approach, there are two options to create the relationship between entities, through:

                1.      Data annotations

                2.      Fluent API

                In this post we will use data annotations to create the relationship between entities.


                Create database with one table

                Let us start with creating a table named Student in a database with the code first approach. The domain class Student can be created as shown in the listing below:


                namespace CodeFirstDemoApp

                {

                   publicclassStudent

                    {

                       publicint Id { get; set; }

                       publicstring Name { get; set; }


                       publicint Age { get; set; }


                    }

                }


                As you might have already noticed, the Student class is a plain class. Entity Framework will use the Student class to create the table in the database. The Student class represents the domain entity and it should not have any information or references of the database. Entity Framework will use the Student class to create the Student table.

                Once the domain entity class is created, next we need to create a Context class which will inherit the DataContext class. The context class can be created as shown in the listing below:


                using System.Data.Entity;


                namespace CodeFirstDemoApp

                {

                    publicclassContext : DbContext

                    {

                        public Context() : base()

                        {

                        }

                        publicDbSet<Student> Students { get; set; }

                    }

                }

                We have created the Context class with the default constructor. Later in the post we will talk about various options in the constructor. In the context class we are doing the following tasks:

                ·        Creating the default constructor. Since we are not passing any parameter in the constructor, so the EF will create a database with the name as Namespace.Class name. So in this case, the created database name will be CodeFirstDemo.Context.

                ·        Since we are not passing a connection string information in the constructor of Context class, the EF will create a database in the default database server of SQL Server Express.

                ·        To create a database in the desired server with the desired name, we need to create the connection string and pass that as a parameter in the Context constructor.

                ·        To create the table in the database, create a public property of the generic DbSet type with domain entity passed in it.


                So far we have created the Student entity class and the Context class. Now we can write a simple LINQ to Entity query to create the database and perform the operations as shown in the listing below:


                using System;

                using System.Linq;


                namespace CodeFirstDemoApp

                {

                    classProgram

                    {

                        staticvoid Main(string[] args)

                        {

                            CreateStudent();

                            Console.WriteLine("Student Creatred");


                            Context c = newContext();

                            var result = from r in c.Students select r;

                            foreach (var r in result)

                            {

                                Console.WriteLine(r.Name);

                            }


                            Console.ReadKey(true);

                        }


                        staticvoid CreateStudent()

                        {

                            Student s = newStudent

                            {

                                Id = 1,

                                Age = 12,

                                Name = "Foo"

                            };

                                Context c = newContext();

                                c.Students.Add(s);

                                c.SaveChanges();

                        }

                    }

                }


                Custom database name

                When we work with the default constructor for the Context class, EF by default creates the database with a fully qualified name as Namespace.Contextclass name. However we can pass the desired name of the database mydb in this case in the constructor as shown in the listing below:

                public Context()

                            : base("mydb")

                        {


                        }


                In the SQL Express EF will create a database with the name mydb.


                Working with Connection String

                As of now we are relying on the EF to create the database. However we can pass a connection string to create a database at the desired server and a name. The connection string can be created in the config file as listed below:

                <connectionStrings>

                    <addname="democonnectionstring"connectionString="Data Source=(LocalDb)\v11.0;Initial Catalog=Demo1;Integrated Security=True;MultipleActiveResultSets=true"providerName="System.Data.SqlClient"/>

                    </connectionStrings>


                We have created a connection string to create a database in local db server. Next we need to pass the connection string name in the constructor of Context class as shown in the listing below:

                  public Context()

                            : base("name=democonnectionstring")

                        {


                        }


                Relationship between Entities

                In the Code First approach, we can create a relationship between entities using either of the two options:

                1.      Data Annotations

                2.      Fluent API

                In this post we will create relationship using data annotations.


                One to One Relationship

                We may have a requirement to create one to one relationships between two entities. In other words, we need a Primary key – Foreign Key relationship between two entities. Let us say we have two entities and the following rules:

                1.      There are two entities named Student and StudentAccount

                2.      Student is a primary entity

                3.     StudentAccount is a dependent entity on Student

                4.     Primary key of StudentAccount will be foreign key of Student

                We should not able to create a StudentAccount without a Student and there can only be one entry of Student in StudentAccount. Put simply, each Student will have one StudentAccount and no StudentAccount will exist without a Student.

                Let us first create the primary entity: Student

                 publicclassStudent

                    {


                       publicint Id { get; set; }

                       publicstring Name { get; set; }


                       publicint Age { get; set; }


                       publicvirtualStudentAccount StudentAccount { get; set; }


                    }


                As you might have noticed, in the Student entity we have a virtual property of the type StudentAccount which is created as shown the listing below:


                  publicclassStudentAccount

                    {

                        publicint Id { get; set; }


                        publicstring Name { get; set; }


                        publicint Amount { get; set; }


                        [Required]

                        publicvirtualStudent Student { get; set; }


                    }


                Again you might have noticed that in the StudentAccount entity we have a virtual property of the type Student. Since Student is a primary entity, the virtual Student property in the StudentAccount entity is annotated Required. Further, a Context class can be created as shown in the listing below:


                using System.Data.Entity;


                namespace CodeFirstDemoApp

                {

                    publicclassContext : DbContext

                    {

                        public Context()

                            : base("name=democonnectionstring")

                        {


                        }

                        publicDbSet<Student> Students { get; set; }

                        publicDbSet<StudentAccount> StudentAccounts{ get; set; }

                    }

                }

                Always remember that we cannot create a row in the StudentAccounts table unless we do not have a corresponding row in the Student table.  Data can be created in the related table as shown in the listing below:


                  staticvoid CreateStudent()

                        {

                            Student s = newStudent

                            {

                                Id = 1,

                                Age = 12,

                                Name = "Foo"

                            };

                            StudentAccount sa = newStudentAccount

                            {

                                Amount = 300,

                                Name = "Sports Account",

                                Student = s

                            };

                                Context c = newContext();

                                c.Students.Add(s);

                                c.StudentAccounts.Add(sa);

                                c.SaveChanges();

                        }


                As you might have noticed, we are setting the object of Student as a property of StudentAccount.  We can retrieve records from both the tables as shown in the listing below:

                Context c = newContext();

                            var result = from r in c.Students select r;

                            foreach (var r in result)

                            {

                                Console.WriteLine(r.Name);

                                Console.WriteLine(r.StudentAccounts.Amount);

                            }


                To verify the relationship between entities in SQL Server Management Studio, we can see the columns created with the constraints and keys as shown in the image below:


                Here the Id column of the StudentAccounts table is both the primary key and foreign key.


                One to Many Relationship

                We may have a requirement to create one too many relationship between two entities. Let us say we have two entities

                1.      There are two entities Student and StudentAddress

                2.      Student is a primary entity

                3.     StudentAddress is a dependent entity on Student

                4.     One Student can enroll in multiple StudentAddress

                One Student can have many StudentAddress. One of the column of StudentAddress will have foreign key as primary key of Student.

                Let us first create the primary entity Student,


                publicclassStudent

                    {


                      public Student()

                       {

                           StudentAddresses = newHashSet<StudentAddress>();

                       }

                       publicint Id { get; set; }

                       publicstring Name { get; set; }


                       publicint Age { get; set; }


                       publicICollection<StudentAddress> StudentAddresses { get; set; }


                    }


                You might have noticed that we are creating a property of collection of StudentAddress and then creating a set value of the StudentAddress property in the constructor of Student. The StudentAddress class can be created as shown in the listing below:


                publicclassStudentAddress

                    {

                        publicint Id { get; set; }

                        publicstring  Address { get; set;}


                        publicint StudentId { get; set; }


                        publicvirtualStudent Student { get; set; }

                    }


                Again you might have noticed that in the StudentAddress entity we have a virtual property of the type Student. Since Student is a primary entity, the virtual Student property in the StudentAddress has a corresponding StudentId property.

                Further, the Context class can be created as shown in the listing below:


                publicclassContext : DbContext

                    {

                        public Context()

                            : base("name=democonnectionstring")

                        {


                        }

                        publicDbSet<Student> Students { get; set; }

                        publicDbSet<StudentAddress> StudentAddresses { get; set; }

                    }


                Always remember that we cannot create a row in the StudentAddress table unless we do not have a corresponding row in the Student table. Data can be created in the related table as shown in the listing below:


                   staticvoid CreateStudent()

                        {

                            Student s = newStudent

                            {

                                Id = 1,

                                Age = 12,

                                Name = "Foo"

                            };


                            StudentAddress sa1 = newStudentAddress { Address = "Delhi", Id = 1 };

                            StudentAddress sa2 = newStudentAddress { Address = "Bangalore", Id = 2 };

                            s.StudentAddresses.Add(sa1);

                            s.StudentAddresses.Add(sa2);


                                Context c = newContext();

                                c.Students.Add(s);              

                                c.SaveChanges();

                        }


                As you might have noticed, we are adding the objects of StudentAddress to the Student.  We can retrieve records from both tables as shown in the listing below:

                staticvoid Main(string[] args)

                        {

                            CreateStudent();

                            Console.WriteLine("Student Created");


                            Context c = newContext();

                            var result = from r in c.Students.Include("StudentAddresses") select r;

                            foreach (var r in result)

                            {

                                Console.WriteLine(r.Name);

                                foreach(var a in r.StudentAddresses)

                                {

                                    Console.WriteLine(a.Address);

                                }

                            }


                            Console.ReadKey(true);

                        }


                To verify the relationship between entities in SQL Server Management Studio, we can see the columns created with the constraints and keys as shown in the image below:


                Many to Many Relationship

                Last but not least, let us see how we can configure a many to many relationship. Let’s say we have a Student entity and a Subject entity. One Student can be enrolled in many Subjects and One Subject can have many Students. To create a many too many relationship between these entities, let us first create the Student entity as shown in the listing below:

                publicclassStudent

                    {


                      public Student()

                       {

                           Subjects = newHashSet<Subject>();

                       }

                       publicint Id { get; set; }

                       publicstring Name { get; set; }


                       publicint Age { get; set; }


                       publicICollection<Subject> Subjects { get; set; }


                    }


                Here we’re creating a property of collection of Subjects and then creating a set value of the Subjects property in the constructor of Student. The Subject class can be created as shown in the listing below:


                  publicclassSubject

                    {

                        public Subject()

                        {

                            Students = newHashSet<Student>();


                        }

                        publicint Id { get; set; }


                        publicstring Name { get; set; }


                        publicvirtualICollection<Student> Students { get; set; }

                    }


                In the Subject class also we are creating property of collection of Students and in the constructor of Subject class creating a set of students. This is all we need to do to create a many too many relationship between entities.

                Further, the Context class can be created as shown in the listing below:

                publicclassContext : DbContext

                    {

                        public Context()

                            : base("name=democonnectionstring")

                        {


                        }

                        publicDbSet<Student> Students { get; set; }


                        publicDbSet<Subject> Subjects { get; set; }

                    }


                We can create the rows in the Students and Subjects table as shown in the listing below:

                staticvoid CreateStudent()

                        {

                            Student s = newStudent

                            {

                                Id = 1,

                                Age = 12,

                                Name = "Foo"

                            };


                            Subject s1 = newSubject { Id = 1, Name = "Phy" };

                            Subject s2 = newSubject { Id = 2, Name = "Maths" };

                            s.Subjects.Add(s1);

                            s.Subjects.Add(s2);


                                Context c = newContext();

                                c.Students.Add(s);              

                                c.SaveChanges();

                        }


                We can retrieve records from both the tables as shown here:


                staticvoid Main(string[] args)

                        {

                            CreateStudent();

                            Console.WriteLine("Student Created");


                            Context c = newContext();

                            var result = from r in c.Students.Include("Subjects") select r;

                            foreach (var r in result)

                            {

                                Console.WriteLine(r.Name);

                                foreach(var a in r.Subjects)

                                {

                                    Console.WriteLine(a.Name);

                                }

                            }


                            Console.ReadKey(true);

                        }

                When we verify the relationship between the Student and Subject entity, we will find that EF has created an extra table to maintain the many to many relationship

                So there you have it, that’s how to create relationships between entities in the Code First approach. In this post we started with working with single entities and then proceeded to create a relationship between the entities. I hope you find this post useful, thanks for reading.


                Infragistics Ultimate 15.2 is here. Download and see its power in action!

                WinPivotGrid - it's not just for OLAP anymore...

                $
                0
                0

                WinPivotGrid - it's not just for OLAP anymore...

                WinPivotGrid is typically associated with OLAP (Online Analytical Processing) data, serving as a front end for MDX and XMLA data sources. It also supports the presentation of non-hierarchical data via the FlatDataSource class.

                This article discusses the new database adapter classes which were added in the 15.2 release to facilitate the presentation of data obtained from database tables in the WinPivotGrid control.

                What exactly does 'OLAP' mean anyway?

                OnLine Analytical Processing.

                Well, that's what each letter in the acronym stands for, anyway. I'll defer the formal definition to the folks over at OLAP.com, who can presumably explain it better than I:

                " OLAP is the technology behind many Business Intelligence (BI) applications. OLAP is a powerful technology for data discovery, including capabilities for limitless report viewing, complex analytical calculations, and predictive 'what if' scenario (budget, forecast) planning. "

                Okay...sounds cool. Data discovery, limitless report viewing, complex calculations, etc. Yes, all these things sound like stuff I'd like to have in my application. How do I get that?

                OLAP please - and hold the server.

                So one way to go about incorporating business intelligence into your applications is to familiarize yourself with Microsoft's SQL Server Analysis Services (SSAS) model. You might need to make a few stops along the way for things like server configurations, user permissions, integrating with SQL Server, and then of course on to the actual business of data mining, dimensions, cubes, roles, KPIs...and probably a few acronyms I've neglected to mention.

                Getting the point? None of this is terribly difficult, but can be time consuming - more so if you don't already have access to these things. Wouldn't it be great if you could bypass all this SSAS business and go straight to the part where your users are slicing and dicing data just like they would on a fancy OLAP server?

                Introducing the FlatDataSource.

                Designed specifically so that you can get all that neat multi-dimensional data presentation (and all the slicing, dicing, and filtering that goes along with it), without an OLAP server, the FlatDataSource class was introduced with the 14.2 release. All you need is a standard, garden variety .NET class, and an IEnumerable implementation that contains the instances of this class which comprise your data set. You create a FlatDataSource instance with this IEnumerable implementation, assign it to the WinPivotGrid's DataSource property, and that's really it...

                What's that? You don't believe me? Alright, let's go through it step-by-step with a quick example.

                1. The .NET class

                  Let's assume you have a .NET class named CustomerOrder, with all the data required to describe an order for a given product, made by a given customer on a given date. Oh, yes - with the price of that product...finance people get all bent out of shape when you don't include that kind of stuff.

                  A C# implementation of such a class would look something like this:

                  CodeSnippet-CustomerOrder

                2. The IEnumerable implementation

                  Now we need an IEnumerable implementation which consists of instances of this CustomerOrder class, with each instance representing an actual order. We'll assume this part is self-evident, and continue on to the creation of the FlatDataSource instance which we use to serve this data to the WinPivotGrid control. That code looks something like this:

                  CodeSnippet-IEnumerable

                3. The End Result

                  As you can see, the data which we generated from a "non-OLAP" data source appears in the WinPivotGrid exactly as if it were produced by an OLAP query. Users can slice, dice and filter this data any which way they like:

                  PivotGrid DataSelector

                4. The Missing Piece

                  The astute reader will have noticed that in section 2, The IEnumerable Implementation, there is a call to a method named GetData at line 44...and the GetData method implementation is nowhere to be found...huh?

                  Now I could give you one of the usual excuses like, "beyond the scope of this article" or my personal favorite, "omitted for the sake of brevity" (as if the internet were running out of space and my saving a couple of kilobytes here is going to stave off impending doom). The fact is, there's nothing fancy going on in there, but it does represent several hundred lines of code, mostly involving database querying and table joining and all that good stuff, which may very well be off the point of this article, but is still of interest to anyone who wants to use the WinPivotGrid to display data from "regular" databases.

                  Wait a minute - did you say several hundred lines of code??? Gulp. Yes, that's what I said. You've got to connect to the database, query it across a couple of different tables, create instances of a proxy class to hold the flattened data, and get the resulting recordset into an IEnumerable implementation containing a list of those proxy class instances. Certainly not rocket science, just tedious, manual labor. There's got to be a better way...right?

                Adapt and Overcome.

                In order to address this shortcoming, a new namespace was added in the Infragistics.Olap.DataSource.Flat assembly, Infragistics.Olap.FlatData.Adapters. This namespace contains two new classes, SqlAdapter and OleDbAdapter, each representing a liason between the WinPivotGrid control and a database table or query.

                These adapters greatly simplify the act of querying a 'standard', i.e., non-OLAP database, and presenting the result in the WinPivotGrid control. In the simplest case, only two properties need to be set - one for the connection string which establishes the connection to the database, and one for the SQL statement that defines the data to be returned.

                The following code sample gives you an idea of how these adapters work:

                CodeSnippet-SetDataSource

                In closing.

                Hopefully you'll agree that these data adapters greatly simplify the problem of presenting standard database data in the WinPivotGrid control. If any of the material presented here was unclear, or you have further questions, post in the WinPivotGrid Forum, and we'll be happy to help you out.

                Developer News - What's IN with the Infragistics Community? (10/5-10/18)

                $
                0
                0

                You guys are ALL about the "Top" Lists this time! I had a blast reading through these, and I'm sure you'll learn at least one thing too. Check them out and don't be shy -- share your favorite development related top list too!

                6. Guess What's Now the Most Popular Course at Harvard (Quartz)

                5. 6 Top Programming Languages for Mobile Development (InformationWeek)

                4. 15 HTML5 Tools to Make Your Life Easier (Creative Bloq)

                3. Rating Programming Languages – Swift is Hot, Dart is Not (CIO)

                2. 10 Most Used git Commands (Excel with Code)

                1. 9 Ways Google is Changing the World (Business Insider)

                What Is Microsoft's SharePoint Market Size Worldwide?

                $
                0
                0

                SharePoint is undoubtedly one of the world’s most important and widespread enterprise productivity tools. However, Microsoft are, quite naturally, secretive about the actual value of the product. In today’s post, we'll be trying to discover that answer by taking a high-level overview of SharePoint’s growth and adoption worldwide. Furthermore, we'll be looking at how it is doing in terms of usage, market growth, revenue and so on.

                Since its introduction in 2001, the product has seen accelerated rates of deployment across many realms. Some famous examples of engaging SharePoint environments were created by the Ministry of Sound and Ferrari. Alongside this, SharePoint as a communications tool saw companies like Vodafone and Heineken construct impressive and award winning intranet platforms for communicating with staff.

                The road to success

                To best gauge SharePoint's gradual journey to success, let's have a look at the SharePoint timeline over the last few years.

                There are a number of key dates in the fabled history of SharePoint. These help us to set the scene when assessing its market share over the last few years: 

                • SharePoint 2007: Released in November 2006, this edition laid the foundation of many features that have been heavily used since. SPD, content types, permission groups and more were introduced.
                • SharePoint 2010: This product was released in May 2010 and saw the product evolve further with such features as the inclusion of PowerShell support, Office Ribbon (that had previously been introduced in the Office Suite 2007) and sandboxed solutions.
                • Skype Acquisition: Microsoft confirmed that they had struck a deal to buy out Skype.
                • Acquisition of Yammer: Yammer was purchased by Microsoft in June 2012, with a goal to integrate into Office 365.
                • SharePoint 2013: This was released to the market on November 2012 and saw more changes made, such as a revamped search and the replacement of MySites with OneDrive.

                We can flesh this timeline out further by including two more relevant events.  These are:

                • Office 365 Launch: Office 365 & SharePoint Online were launched in June 2011 and were based on the SharePoint 2010 interface.
                • Office 365 Upgrade:  The SharePoint Kernel of Office 365 was upgraded to SharePoint 2013 in February of that year.

                So, with these dates in mind, how could we assess SharePoint’s global market size?

                SharePoint in 2010

                In 2009, SharePoint was a $1.3 billion business with more than 100 million users. As a result, there was a lot of pressure on Microsoft to deliver a solid upgrade on SharePoint 2007. As such, 2010 was a big year for SharePoint as May 2010 saw the delivery of the first truly mature version of the product. As alluded to in the timeline above, a lot of new and "foundation-making" enhancements were all building on a very solid SharePoint 2007. This was the first instance we saw high levels of synergy between Office Clients and SharePoint, and it was also the year that Microsoft revealed their ambition to conquer the cloud. Steve Ballmer coined the term "Software as a Service" for the first time.

                SharePoint in 2011

                Fresh on the heels of launching SharePoint 2010, Microsoft launched their assault on the heavens with the June 2011 release of Office 365. This was the replacement for the earlier ill-fated BPOS and had been designed from the ground up with both cloud architecture and security in mind. In 2011, Microsoft earned an estimated $1.3 billion in licensing revenue alone. This was also the year that SharePoint celebrated its 10th anniversary. Microsoft took the opportunity to emphasize their commitment to Office 365.

                SharePoint in 2012

                2012 saw both some interesting figures and important movements on the technology front. Statistically, SharePoint passed the $2 billion mark for earned revenues. Microsoft also claimed that two in every three knowledge workers had worked with SharePoint. On the technology front, Microsoft also purchased a potential rival in the collaborative market when they acquired the Enterprise Social Network known as Yammer. The market also saw the release of the long awaited SharePoint 2013.

                SharePoint in 2013

                Early in the year, Microsoft upgraded the Office 365 experience to match that of SharePoint 2013.

                SharePoint in 2015

                Microsoft are expected to continue their market dominance of enterprise collaboration sectors in the coming years. The company is projected to grow at an annual average growth rate of 20% over the next four years, so we can expect many more good things to come.

                Major player

                SharePoint holds a major place in what is undoubtedly a competitive and multi-billion-dollar industry. A product earning $2bn in 2012 which was mostly On-Premises based and yet to see the benefits of Skype, Yammer or the next-generation features of Delve or Sway will be worth a great deal more today. 

                For some time, there was talk of Microsoft only pushing Office 365, but recently published news regarding the future of On-Premises and hybrid builds is reassuring. This means that not only is a greater technological scope catered for, but there is more opportunity for Microsoft to increase their market share moving forwards and converting these into very rewarding revenue streams.

                Looking to mobilize your corporate SharePoint? Check out Infragistics' SharePlus' demo: the ultimate mobile productivity solution for SharePoint and Office 365.

                Viewing all 2223 articles
                Browse latest View live


                Latest Images