Quantcast
Channel: Infragistics Community
Viewing all 2223 articles
Browse latest View live

Ember.js From the Ground Up Series

$
0
0

This is where I’ll be collecting my posts for my Ember.js tutorial series. Follow along and learn Ember.js from the ground up!

ember-from-the-ground-up

Posts:

Contact

If you want to comment or reach out to me, the best place to do that is on Twitter @brentschooley. I can also be reached via email at bschooley@infragistics.com.


Infragistics ASP.NET Release Notes - November: 13.2 Volume Release

$
0
0

With every release comes a set of release notes that reflects the state of resolved bugs and new additions from the previous release. You’ll find the notes useful to help determine the resolution of existing issues from a past release and as a means of determining where to test your applications when upgrading from one version to the next.

Release notes are available in both PDF and Excel formats. The PDF summarizes the changes to this release along with a listing of each item. The Excel sheet includes each change item and makes it easy for you to sort, filter and otherwise manipulate the data to your liking.

Download the Release Notes

ASP.NET 2013 Volume 2

Infragistics Reporting Release Notes – November: 12.2, 13.1 Service Releases

$
0
0

With every release of Infragistics Reporting comes a set of release notes that reflects the state of resolved bugs and new additions from the previous release. You’ll find the notes useful to help determine the resolution of existing issues from a past release and as a means of determining where to test your applications when upgrading from one version to the next.

The Release Notes are available in PDF format and summarize the changes to this release along with a listing of each item. In order to download the release notes, use the following links:

Reporting 2012 Volume 2

Reporting 2013 Volume 1

Infragistics WPF Release Notes – November: 13.2 Volume Release

$
0
0

Release notes reflect the state of resolved bugs and new additions from the previous release. You will find these notes useful to help determine the resolution of existing issues from a past release and as a means of determining where to test your applications when upgrading from one version to the next.

Release notes are available in both PDF and Excel formats. The PDF summarizes the changes to this release along with a listing of each item. The Excel sheet includes each change item and makes it easy for you to sort, filter and otherwise manipulate the data to your liking.

Download the Release Notes

Infragistics Silverlight Release Notes – November: 13.2 Volume Release

$
0
0

Release notes reflect the state of resolved bugs and new additions from the previous release. You wll find these notes useful to help determine the resolution of existing issues from a past release and as a means of determining where to test your applications when upgrading from one version to the next.

Release notes are available in both PDF and Excel formats. The PDF summarizes the changes to this release along with a listing of each item. The Excel sheet includes each change item and makes it easy for you to sort, filter and otherwise manipulate the data to your liking.

Download the Release Notes

Creating Different iOS Progress Types Using IGProgressView (Xcode & Xamarin.iOS)

$
0
0

Introduction

The IGProgressView that comes with the NucliOS controls is an easy to use and extremely flexible control. It's unique design allows for many different progress visualizations, including custom shapes all in one control. This post will cover the many different visual possibilities of the IGProgressView to help you create stunning apps.

Standard

Standard

The #1 annotation shown shows the default shape of standard progress type with it's progress property set to 63.

// Objective-C
IGProgressView *standard1 = [[IGProgressView alloc] initWithStyle:IGProgressViewStyleStandard];
standard1.progress = 0.63;

// C#
IGProgressView standard1 = new IGProgressView (IGProgressViewStyle.IGProgressViewStyleStandard);
standard1.Progress = 0.63f;

The #2 annotation shown demonstrates setting the standardCornerRadius to 0 to achieve a square looking standard progress.

// Objective-C
IGProgressView *standard2 = [[IGProgressView alloc] initWithStyle:IGProgressViewStyleStandard];
standard2.progress = 0.63;
standard2.standardCornerRadius = 0;

// C#
IGProgressView standard2 = new IGProgressView (IGProgressViewStyle.IGProgressViewStyleStandard);
standard2.Progress = 0.63f;
standard2.StandardCornerRadius = 0;

The #3 annotation shown demonstrates the default standard progress shape with the lineWidth set to 5.0 on the exposed progressShapeLayer. This creates a bigger stroke around the displayed progress.

// Objective-C
IGProgressView *standard3 = [[IGProgressView alloc] initWithStyle:IGProgressViewStyleStandard];
standard3.progress = 0.63;
standard3.progressShapeLayer.lineWidth = 5.0;

// C#
IGProgressView standard3 = new IGProgressView (IGProgressViewStyle.IGProgressViewStyleStandard);
standard3.Progress = 0.63f;
standard3.ProgressShapeLayer.LineWidth = 5.0f;

Standard Indeterminate

Standard Indeterminate

The #1 annotation shown shows the default shape of standard indeterminate progress type.

// Objective-C
IGProgressView *standard1 = [[IGProgressView alloc] initWithStyle:IGProgressViewStyleStandardIndeterminate];

// C#
IGProgressView standard1 = new IGProgressView (IGProgressViewStyle.IGProgressViewStyleStandardIndeterminate);

The #2 annotation shown demonstrates setting the standardCornerRadius to 0 to achieve a square looking standard indeterminate progress.

// Objective-C
IGProgressView *standard2 = [[IGProgressView alloc] initWithStyle:IGProgressViewStyleStandardIndeterminate];
standard2.standardCornerRadius = 0;

// C#
IGProgressView standard2 = new IGProgressView (IGProgressViewStyle.IGProgressViewStyleStandardIndeterminate);
standard2.StandardCornerRadius = 0;

The #3 annotation shown demonstrates the default standard indeterminate progress shape with the lineWidth set to 5.0 on the exposed progressShapeLayer. This creates a bigger stroke around the displayed indeterminate progress.

// Objective-C
IGProgressView *standard3 = [[IGProgressView alloc] initWithStyle:IGProgressViewStyleStandardIndeterminate];
standard3.progressShapeLayer.lineWidth = 5.0;

// C#
IGProgressView standard3 = new IGProgressView (IGProgressViewStyle.IGProgressViewStyleStandardIndeterminate);
standard3.ProgressShapeLayer.LineWidth = 5.0f;

Diving Deeper into the Standard Progress Type

Diving Deeper into the Standard Progress Type

The IGProgressView exposes the CAShapeLayers that make up the progress (progressShapeLayer) and the progress track (progressTrackShapeLayer). This allows for complete control over the styling and the finer details of what's rendered. In the following snippet, the progress progressTintColor has been change to red, and by using the strokeColor property found on the exposed progressShapeLayer property, we change the stroke around the progress to be a deeper shape of red.

// Objective-C
IGProgressView *standard1 = [[IGProgressView alloc] initWithStyle:IGProgressViewStyleStandard];
standard1.progress = 0.63;
standard1.progressTintColor = [UIColor redColor];
standard1.standardCornerRadius = 5;
standard1.progressShapeLayer.lineWidth = 3.0;
standard1.progressShapeLayer.strokeColor = [UIColor colorWithRed:0.8 green:0 blue:0 alpha:1.0].CGColor;

// C#
IGProgressView standard1 = new IGProgressView (IGProgressViewStyle.IGProgressViewStyleStandard);
standard1.Progress = 0.63f;
standard1.ProgressTintColor = UIColor.Red;
standard1.StandardCornerRadius = 5;
standard1.ProgressShapeLayer.LineWidth = 3.0f;
standard1.ProgressShapeLayer.StrokeColor = UIColor.FromRGB(0.8f, 0.0f, 0.0f).CGColor;

Radial

Radial

The #1 annotation shown shows the default shape of radial progress type.

// Objective-C
IGProgressView *radial1 = [[IGProgressView alloc] initWithStyle:IGProgressViewStyleRadial];
radial1.progress = 0.63;

// C#
IGProgressView radial1 = new IGProgressView (IGProgressViewStyle.IGProgressViewStyleRadial);
radial1.Progress = 0.63f;

The #2 annotation shown demonstrates setting the radialInsertScale property to 0.5 to shrink the size of the inset down to expose more of the progress shape and track under it.

// Objective-C
IGProgressView *radial2 = [[IGProgressView alloc] initWithStyle:IGProgressViewStyleRadial];
radial2.progress = 0.63;
radial2.radialInsertScale = 0.5;

// C#
IGProgressView radial2 = new IGProgressView (IGProgressViewStyle.IGProgressViewStyleRadial);
radial2.Progress = 0.63f;
radial2.RadialInsertScale = 0.5f;

The #3 annotation shown demonstrates setting the radialInsertScale property to 0.0 to completely shrink the size of the inset down to nothing and expose the progress shape and track under it.

// Objective-C
IGProgressView *radial3 = [[IGProgressView alloc] initWithStyle:IGProgressViewStyleRadial];
radial3.progress = 0.63;
radial3.radialInsertScale = 0;

// C#
IGProgressView radial3 = new IGProgressView (IGProgressViewStyle.IGProgressViewStyleRadial);
radial3.Progress = 0.63f;
radial3.RadialInsertScale = 0.0f;

Radial Indeterminate

Radial Indeterminate

The #1 annotation shown shows the default shape of radial indeterminate progress type.

// Objective-C
IGProgressView *radial1 = [[IGProgressView alloc] initWithStyle:IGProgressViewStyleRadialIndeterminate];

// C#
IGProgressView radial1 = new IGProgressView (IGProgressViewStyle.IGProgressViewStyleRadialIndeterminate);

The #2 annotation shown demonstrates setting the radialInsertScale property to 0.5 to shrink the size of the inset down to expose more of the indeterminate progress shape and track under it.

// Objective-C
IGProgressView *radial2 = [[IGProgressView alloc] initWithStyle:IGProgressViewStyleRadialIndeterminate];
radial2.radialInsertScale = 0.5;

// C#
IGProgressView radial2 = new IGProgressView (IGProgressViewStyle.IGProgressViewStyleRadialIndeterminate);
radial2.RadialInsertScale = 0.5f;

The #3 annotation shown demonstrates setting the radialInsertScale property to 0.0 to completely shrink the size of the inset down to nothing and expose the indeterminate progress shape and track under it.

// Objective-C
IGProgressView *radial3 = [[IGProgressView alloc] initWithStyle:IGProgressViewStyleRadialIndeterminate];
radial3.radialInsertScale = 0;

// C#
IGProgressView radial3 = new IGProgressView (IGProgressViewStyle.IGProgressViewStyleRadialIndeterminate);
radial3.RadialInsertScale = 0.0f;

Diving Deeper into the Radial Progress Type

Diving Deeper into the Radial Progress Type

The IGProgressView exposes the CAShapeLayers that make up the progress (progressShapeLayer) and the progress track (progressTrackShapeLayer). This allows for complete control over the styling and the finer details of what's rendered. Additionally, the radial progress type has properties that allow you to set a radialStartAngle and radialEndAngle, as well as the radialInsertScale to control how much of the progress and track shape is exposed. In the following snippet, the radial progress is set with a radialStartAngle of 180 degrees and radialEndAngle of 0 degrees, and the radialInsertScale is set to 0.75.

// Objective-C
IGProgressView *radial1 = [[IGProgressView alloc] initWithStyle:IGProgressViewStyleRadial];
radial1.progress = 0.63;
radial1.radialInsertScale = 0.75;
radial1.radialStartAngle = 180;
radial1.radialEndAngle = 0;

// C#
IGProgressView radial1 = new IGProgressView (IGProgressViewStyle.IGProgressViewStyleRadialIndeterminate);
radial1.Progress = 0.63f;
radial1.RadialInsertScale = 0.75f;
radial1.RadialStartAngle = 180.0f;
radial1.RadialEndAngle = 0.0f;

Custom

Custom

The IGProgressView supports using a CGPath to create a custom progress shape. Mac apps such as PaintCode make the creation of these paths easy and the possiblities endless. In the code snippet below, we use a custom path that draws out 5 stars, each would represent 20% of the total progress. The progress property is then be set to 80%, which fills 4 out of the 5 stars.

// Objective-C
IGProgressView *custom1 = [[IGProgressView alloc] initWithCustomShape:[self starsPath].CGPath];
custom1.progress = 0.80;

- (UIBezierPath *)starsPath
{
    UIBezierPath *starsPath = [UIBezierPath bezierPath];
    [starsPath moveToPoint:CGPointMake(20.5, 6.5)];
    [starsPath addLineToPoint:CGPointMake(13.45, 16.79)];
    [starsPath addLineToPoint:CGPointMake(1.48, 20.32)];
    [starsPath addLineToPoint:CGPointMake(9.09, 30.21)];
    [starsPath addLineToPoint:CGPointMake(8.74, 42.68)];
    [starsPath addLineToPoint:CGPointMake(20.5, 38.5)];
    [starsPath addLineToPoint:CGPointMake(32.26, 42.68)];
    [starsPath addLineToPoint:CGPointMake(31.91, 30.21)];
    [starsPath addLineToPoint:CGPointMake(39.52, 20.32)];
    [starsPath addLineToPoint:CGPointMake(27.55, 16.79)];
    [starsPath addLineToPoint:CGPointMake(20.5, 6.5)];
    [starsPath closePath];
    [starsPath moveToPoint:CGPointMake(60.5, 6.5)];
    [starsPath addLineToPoint:CGPointMake(53.45, 16.79)];
    [starsPath addLineToPoint:CGPointMake(41.48, 20.32)];
    [starsPath addLineToPoint:CGPointMake(49.09, 30.21)];
    [starsPath addLineToPoint:CGPointMake(48.74, 42.68)];
    [starsPath addLineToPoint:CGPointMake(60.5, 38.5)];
    [starsPath addLineToPoint:CGPointMake(72.26, 42.68)];
    [starsPath addLineToPoint:CGPointMake(71.91, 30.21)];
    [starsPath addLineToPoint:CGPointMake(79.52, 20.32)];
    [starsPath addLineToPoint:CGPointMake(67.55, 16.79)];
    [starsPath addLineToPoint:CGPointMake(60.5, 6.5)];
    [starsPath closePath];
    [starsPath moveToPoint:CGPointMake(100.5, 6.5)];
    [starsPath addLineToPoint:CGPointMake(93.45, 16.79)];
    [starsPath addLineToPoint:CGPointMake(81.48, 20.32)];
    [starsPath addLineToPoint:CGPointMake(89.09, 30.21)];
    [starsPath addLineToPoint:CGPointMake(88.74, 42.68)];
    [starsPath addLineToPoint:CGPointMake(100.5, 38.5)];
    [starsPath addLineToPoint:CGPointMake(112.26, 42.68)];
    [starsPath addLineToPoint:CGPointMake(111.91, 30.21)];
    [starsPath addLineToPoint:CGPointMake(119.52, 20.32)];
    [starsPath addLineToPoint:CGPointMake(107.55, 16.79)];
    [starsPath addLineToPoint:CGPointMake(100.5, 6.5)];
    [starsPath closePath];
    [starsPath moveToPoint:CGPointMake(140.5, 6.5)];
    [starsPath addLineToPoint:CGPointMake(133.45, 16.79)];
    [starsPath addLineToPoint:CGPointMake(121.48, 20.32)];
    [starsPath addLineToPoint:CGPointMake(129.09, 30.21)];
    [starsPath addLineToPoint:CGPointMake(128.74, 42.68)];
    [starsPath addLineToPoint:CGPointMake(140.5, 38.5)];
    [starsPath addLineToPoint:CGPointMake(152.26, 42.68)];
    [starsPath addLineToPoint:CGPointMake(151.91, 30.21)];
    [starsPath addLineToPoint:CGPointMake(159.52, 20.32)];
    [starsPath addLineToPoint:CGPointMake(147.55, 16.79)];
    [starsPath addLineToPoint:CGPointMake(140.5, 6.5)];
    [starsPath closePath];
    [starsPath moveToPoint:CGPointMake(180.5, 6.5)];
    [starsPath addLineToPoint:CGPointMake(173.45, 16.79)];
    [starsPath addLineToPoint:CGPointMake(161.48, 20.32)];
    [starsPath addLineToPoint:CGPointMake(169.09, 30.21)];
    [starsPath addLineToPoint:CGPointMake(168.74, 42.68)];
    [starsPath addLineToPoint:CGPointMake(180.5, 38.5)];
    [starsPath addLineToPoint:CGPointMake(192.26, 42.68)];
    [starsPath addLineToPoint:CGPointMake(191.91, 30.21)];
    [starsPath addLineToPoint:CGPointMake(199.52, 20.32)];
    [starsPath addLineToPoint:CGPointMake(187.55, 16.79)];
    [starsPath addLineToPoint:CGPointMake(180.5, 6.5)];
    [starsPath closePath];
    return starsPath;
}

// C#
IGProgressView custom1 = new IGProgressView (starsPath().CGPath);
custom1.Progress = 0.80f;
public UIBezierPath starsPath()
{    UIBezierPath starsPath = new UIBezierPath ();    starsPath.MoveTo(new PointF(20.5f, 6.5f));    starsPath.AddLineTo(new PointF(13.45f, 16.79f));    starsPath.AddLineTo(new PointF(1.48f, 20.32f));    starsPath.AddLineTo(new PointF(9.09f, 30.21f));    starsPath.AddLineTo(new PointF(8.74f, 42.68f));    starsPath.AddLineTo(new PointF(20.5f, 38.5f));    starsPath.AddLineTo(new PointF(32.26f, 42.68f));    starsPath.AddLineTo(new PointF(31.91f, 30.21f));    starsPath.AddLineTo(new PointF(39.52f, 20.32f));    starsPath.AddLineTo(new PointF(27.55f, 16.79f));    starsPath.AddLineTo(new PointF(20.5f, 6.5f));    starsPath.ClosePath();    starsPath.MoveTo(new PointF(60.5f, 6.5f));    starsPath.AddLineTo(new PointF(53.45f, 16.79f));    starsPath.AddLineTo(new PointF(41.48f, 20.32f));    starsPath.AddLineTo(new PointF(49.09f, 30.21f));    starsPath.AddLineTo(new PointF(48.74f, 42.68f));    starsPath.AddLineTo(new PointF(60.5f, 38.5f));    starsPath.AddLineTo(new PointF(72.26f, 42.68f));    starsPath.AddLineTo(new PointF(71.91f, 30.21f));    starsPath.AddLineTo(new PointF(79.52f, 20.32f));    starsPath.AddLineTo(new PointF(67.55f, 16.79f));    starsPath.AddLineTo(new PointF(60.5f, 6.5f));    starsPath.ClosePath();    starsPath.MoveTo(new PointF(100.5f, 6.5f));    starsPath.AddLineTo(new PointF(93.45f, 16.79f));    starsPath.AddLineTo(new PointF(81.48f, 20.32f));    starsPath.AddLineTo(new PointF(89.09f, 30.21f));    starsPath.AddLineTo(new PointF(88.74f, 42.68f));    starsPath.AddLineTo(new PointF(100.5f, 38.5f));    starsPath.AddLineTo(new PointF(112.26f, 42.68f));    starsPath.AddLineTo(new PointF(111.91f, 30.21f));    starsPath.AddLineTo(new PointF(119.52f, 20.32f));    starsPath.AddLineTo(new PointF(107.55f, 16.79f));    starsPath.AddLineTo(new PointF(100.5f, 6.5f));    starsPath.ClosePath();    starsPath.MoveTo(new PointF(140.5f, 6.5f));    starsPath.AddLineTo(new PointF(133.45f, 16.79f));    starsPath.AddLineTo(new PointF(121.48f, 20.32f));    starsPath.AddLineTo(new PointF(129.09f, 30.21f));    starsPath.AddLineTo(new PointF(128.74f, 42.68f));    starsPath.AddLineTo(new PointF(140.5f, 38.5f));    starsPath.AddLineTo(new PointF(152.26f, 42.68f));    starsPath.AddLineTo(new PointF(151.91f, 30.21f));    starsPath.AddLineTo(new PointF(159.52f, 20.32f));    starsPath.AddLineTo(new PointF(147.55f, 16.79f));    starsPath.AddLineTo(new PointF(140.5f, 6.5f));    starsPath.ClosePath();    starsPath.MoveTo(new PointF(180.5f, 6.5f));    starsPath.AddLineTo(new PointF(173.45f, 16.79f));    starsPath.AddLineTo(new PointF(161.48f, 20.32f));    starsPath.AddLineTo(new PointF(169.09f, 30.21f));    starsPath.AddLineTo(new PointF(168.74f, 42.68f));    starsPath.AddLineTo(new PointF(180.5f, 38.5f));    starsPath.AddLineTo(new PointF(192.26f, 42.68f));    starsPath.AddLineTo(new PointF(191.91f, 30.21f));    starsPath.AddLineTo(new PointF(199.52f, 20.32f));    starsPath.AddLineTo(new PointF(187.55f, 16.79f));    starsPath.AddLineTo(new PointF(180.5f, 6.5f));    starsPath.ClosePath();}

Further Reference

Every styling point of the IGProgressView wasn't discussed in this post, but the IGProgress has a rich API that you'll find to be very easy to get up and running with. Below are links to the API reference page as well as the developer's guide.

API Reference for IGProgressView - http://help.infragistics.com/iOS/2013.2/gridapi/Classes/IGProgressView.html
Developer's Guide Documentation for IGProgressView - http://help.infragistics.com/iOS/2013.2/?page=IGProgressView.html

By Torrey Betts

Ignite UI Release Notes - November: 13.2 Volume Release

$
0
0

With every release comes a set of release notes that reflects the state of resolved bugs and new additions from the previous release. You’ll find the notes useful to help determine the resolution of existing issues from a past release and as a means of determining where to test your applications when upgrading from one version to the next.

Release notes are available in both PDF and Excel formats. The PDF summarizes the changes to this release along with a listing of each item. The Excel sheet includes each change item and makes it easy for you to sort, filter and otherwise manipulate the data to your liking.

Download the Release Notes

Ignite UI 2013 Volume 2

Is it time to open source Silverlight?

$
0
0

Call to action: Vote on User Voice for Silverlight to be open sourced http://visualstudio.uservoice.com/forums/121579-visual-studio/suggestions/5042512-open-source-silverlight 


Originally posted on my personal blog http://davidburela.wordpress.com/2013/11/22/is-it-time-to-open-source-silverlight/

For all intents and purposes Microsoft now views Silverlight as “Done”. While it is no longer in active development it is still being “supported” through to 2021 (source).
In today’s age of the “modern public web” with a variety of devices, Silverlight’s purpose no longer stands.

However there is still a section of the .Net community that would like to see further development done on the Silverlight framework. It has a nice collection of portable technologies allows it a small niche in the desktop environment. A quick look at some common request lists brings up the following stats:

Rather than letting Silverlight decay in a locked up source control in the Microsoft vaults, I call on them to instead release it into the hands of the community to see what they can build with it. Microsoft may no longer have a long term vision for it, but the community itself may find ways to extend it in ways Microsoft didn’t envision.
Earlier this year Microsoft open sourced RIA Services on Outer Curve http://www.outercurve.org/Galleries/ASPNETOpenSourceGallery/OpenRIAServices, it would be great to see this extended to the entire Silverlight framework.

We’ve seen what can happen with amazing technologies when they are released into the wild. e.g ID software released the Quake 1 source code to the community, it has since been extended greatly and ported to a variety of platforms. A version was even created for Silverlight http://www.innoveware.com/ql3/QuakeLight.html. Which makes sense as XNA running on Silverlight was a popular technology for students.

I’ve used games as examples of ways to extend it as that is what hobbyists usually latch onto first. But there are equal reasons why people still using it on internal LoB applications would want to continue to extend the core framework, e.g:

Silverlight still has a nice portable core of useful technologies, now is the time to start asking the question if it is time to Open Source it rather than let it mothball. There may be uses in the community for it now, in another 2-3 years its usefulness in the community would be lost. This may be a great point to release Silverlight to the community.
Microsoft, let the community know if there is a way we can assist in making this happen.

By David Burela


objc.io - iOS Resource of the Day

$
0
0

In the past, I have posted a lot of resources in a series for HTML5 developers. I hope these have been as helpful for others as they have been for me. That series got me thinking about doing a series for other developers as well, and I think I’ve finally decided on iOS as the focus. There are a lot of great resources out there for iOS, but I’m not convinced that everyone who is doing iOS development is aware of them. So with that in mind, let’s jump right into the first resource: objc.io

objc.io

objc.io - A periodical about best practices and advanced techniques in Objective-C

objc.io started with its first issue in June 2013 and has continued as a monthly publication ever since. This online magazine style publication aims to provide high quality content centered around a single theme once a month. Each issue starts with an editorial article that sets up the theme for the issue. After the editorial there are roughly 4–8 articles based on the theme. The writing quality is superb and some of the best stuff you will find on the internet for iOS development. While the focus is on the Objective-C language, Xamarin developers should still read this as many of the best practices are applicable for C# iOS developers as well.

One thing I really like is the ability to subscribe so that you always know when the latest issue is posted. You can do this in a variety of ways. For starters, you can subscribe to their mailing list. This will send you a short email when each issue is posted. If you are running OS X Mavericks, you can register for a push notification to be sent to your Mac when each issue is posted. If you prefer to read on your iPhone or iPad, objc.io is even available as a Newsstand app. This is a great option if you want to support the objc.io team as it carries a $4.99 monthly subscription. It really is a great format for reading this material. All of the other options are completely free though.

Summary

I highly recommend iOS developers of all types (obj-c and Xamarin, etc.) check objc.io out. Currently there are 6 issues and they are being added once a month. This periodical will definitely make you think about things you may not have considered before.

Contact

If you want to comment or reach out to me, the best place to do that is on Twitter @brentschooley. I can also be reached via email at bschooley@infragistics.com.

Conquering the Last Stronghold: Automating the Results of Automation

$
0
0
Almost every software company nowadays is developing automation for the software it produces. We're building software and we're automating it in parallel. We're also employing a continuous integration process in order to have our automation running on code that is being submitted/checked into our source control while we're developing new code. It's all good, but at some point the automation starts failing. Tests fail because the tests could be inconsistent, because of infrastructure failure or simply because certain functionality in our software has a defect. What do we do then? We analyze why the tests failed and we try to correct the failures.

The automation analysis is performed manually. A survey conducted among twenty two Quality Engineers (more details available at the presentation linked on the bottom of this post) showed that on average 20% of the total time they spend at work is dedicated to performing manual analysis. To put this in perspective: one day each week is entirely dedicated to manual analysis of results produced by the existing automation. One note that should be made here is that this survey is applicable to a mature software product. Products that are in early stages of their life-cycle do not require the same amount of time spent on automation analysis simply because they are still relatively small.


We hypothesized at Infragistics that the software development process can be made self-sustainable by closing the continuous integration cycle.This can be achieved through automating the analysis process on the results coming from the existing automated software testing infrastructure. The purpose of doing this is to allocated the time of the Quality Engineers on more efficiently. If the 20% currently spent on manual analysis is spent on additional automation instead, then we would end up with 25% better automation coverage. As a result the only thing left for us to do is software development and automation coverage for the software development we're doing. In order to achieve this we need to analyze the process that Quality Engineers go through when analyzing automation results. Here's a simple workflow showing that process:

This process has five states including a single entry point which we call "Failed Test", a single exit point called "Bug" and three intermediate steps each of which could lead to the exit point given that a certain condition is met. As you have already noticed this process can easily be turned into a basic state machine with five states. The rest of this post focuses primarily on the "Analyze Point of Failure and Identify the Responsible Party" state. We essentially want to create a consistent framework that automates bug submission given that we have failed tests.

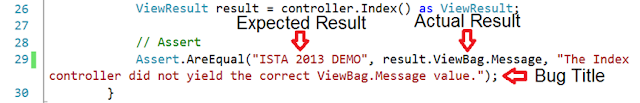
In order to automatically submit bugs for failed tests we need to determine how to provide the appropriate information from the failed tests to the bugs. There are essential bug fields you need to provide regardless of the bug tracking system you may be using. Such fields are the bug title, the steps to reproduce and the expected and actual behaviors. Those can be extracted directly from the failed assert.


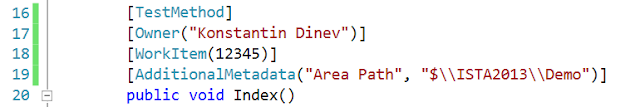
We still need a little more information in order to complete the bug submission. Such fields are the assigned to field, for example, and more additional metadata like area path and iteration. These we can extract from metadata associate with our tests that we otherwise use for other purposes or we don't utilize at all.


These should not lead you to think that automated bug submission is restricted to MSTest only. Those are just examples, but the actual implementation that we're going to talk about later in this post is not at all related to MSTest. It's entirely custom in order to show that this is applicable to mostly any environment that we may be using. It's important to remember that:

  • Concepts presented here are general and are entirely platform and framework independent.
  • Implementation is specific to the platform and the testing framework that is being utilized.

For the implementation I am going to show the following things are needed.

  1. Team Foundation Server (TFS) - manages the CI process
  2. QUnit - unit testing framework for JavaScript
  3. QUnit runner - automated runner for running and extracting the test results

You can download a trial of TFS from Microsoft in order to try out the demo. To set it up use the default project collection.


Then use either the TFS web access or visual studio to connect and setup a team project. The process for doing this is very well described in this article. Setup the project to use Scrum 2.2 template because the implementation of the bug submission framework uses this as a base implementation. If you like you can also setup e custom build template in order to execute the QUnit runner as part of the build. I would not show how to do that because this post is not about the CI process. A good article on how to do that can be found here.

So we setup a simple reporting class that will handle the bug submission for us. The idea behind it is to connect to our project collection and to the specific project that we've created and then to create or modify work items.

Code Snippet
  1. #region Private Members
  2.  
  3. privateTfsTeamProjectCollection _projectCollection;
  4. privateWorkItemStore _store;
  5. privateProject _teamProject;
  6.  
  7. #endregion
  8.  
  9. #region Constructors
  10.  
  11. ///<summary>
  12. /// Initializes a new instance of the <see cref="ReportingCore"/> class with default connection.
  13. ///</summary>
  14. public ReportingCore()
  15. {
  16.     _projectCollection = newTfsTeamProjectCollection(newUri("http://localhost:8080/tfs"));
  17.     _store = _projectCollection.GetService<WorkItemStore>();
  18.     _teamProject = _store.Projects["ISTA2013"];
  19.     TestRun = newList<GenericTestResult>();
  20. }
  21.  
  22. ///<summary>
  23. /// Initializes a new instance of the <see cref="ReportingCore"/> class.
  24. ///</summary>
  25. ///<param name="collectionUri">The TFS project collection URI.</param>
  26. ///<param name="projectName">Name of the TFS project.</param>
  27. public ReportingCore(Uri collectionUri, string projectName)
  28. {
  29.  
  30.     _projectCollection = newTfsTeamProjectCollection(collectionUri);
  31.     _store = _projectCollection.GetService<WorkItemStore>();
  32.     _teamProject = _store.Projects[projectName];
  33.     TestRun = newList<GenericTestResult>();
  34. }
  35.  
  36. #endregion

Then we need to populate some collection of failed tests that we're going to analyze and submit bugs for.

Code Snippet
  1. #region Properties
  2.  
  3. ///<summary>
  4. /// Gets or sets the list of failed tests from the test run.
  5. ///</summary>
  6. ///<value>
  7. /// The failed test run list.
  8. ///</value>
  9. publicList<GenericTestResult> TestRun { get; set; }
  10.  
  11. #endregion
What is this GenericTestResult that we have there?

Code Snippet
  1. ///<summary>
  2. /// Generic test result class. Used to populate failed test results for analysis.
  3. ///</summary>
  4. [Serializable]
  5. publicclassGenericTestResult
  6. {
  7.     #region Properties
  8.  
  9.     ///<summary>
  10.     /// Gets or sets the test expected result.
  11.     ///</summary>
  12.     ///<value>
  13.     /// The expected result.
  14.     ///</value>
  15.     publicstring ExpectedResult { get; set; }
  16.  
  17.     ///<summary>
  18.     /// Gets or sets the test actual result.
  19.     ///</summary>
  20.     ///<value>
  21.     /// The actual result.
  22.     ///</value>
  23.     publicstring ActualResult { get; set; }
  24.  
  25.     ///<summary>
  26.     /// Gets or sets the test title.
  27.     ///</summary>
  28.     ///<value>
  29.     /// The title.
  30.     ///</value>
  31.     publicstring Title { get; set; }
  32.  
  33.     ///<summary>
  34.     /// Gets or sets the test owner.
  35.     ///</summary>
  36.     ///<value>
  37.     /// The owner.
  38.     ///</value>
  39.     publicstring Owner { get; set; }
  40.  
  41.     ///<summary>
  42.     /// Gets or sets the test file.
  43.     ///</summary>
  44.     ///<value>
  45.     /// The file attachment.
  46.     ///</value>
  47.     publicstring FileAttachment { get; set; }
  48.  
  49.     ///<summary>
  50.     /// Gets or sets the test description.
  51.     ///</summary>
  52.     ///<value>
  53.     /// The description.
  54.     ///</value>
  55.     publicstring Description { get; set; }
  56.  
  57.     #endregion
  58. }

Now we need to populate that list whenever we have a failed test in our test run.

Code Snippet
  1. _analysis.TestRun.Add(newGenericTestResult()
  2. {
  3.     Title = testName + " " + message,
  4.     ActualResult = actual,
  5.     FileAttachment = testUrl,
  6.     ExpectedResult = expected,
  7.     Description = message,
  8.     Owner = testConf.Owner
  9. });

Finally let's submit the result to our TFS.

Code Snippet
  1. #region Public Methods
  2.  
  3. ///<summary>
  4. /// Logs a bug.
  5. ///</summary>
  6. publicvoid Submit()
  7. {
  8.     WorkItemType type = _teamProject.WorkItemTypes["Bug"];
  9.     foreach (GenericTestResult failedTest in TestRun)
  10.     {
  11.         failedTest.Title = failedTest.Title.Length < 256 ? failedTest.Title : failedTest.Title.Substring(0, 255);
  12.         WorkItemCollection bugs = _teamProject.Store.Query("SELECT [System.Id] FROM WorkItems WHERE [System.Title] = '" + failedTest.Title + "'");
  13.         if (bugs.Count > 0)
  14.         {
  15.             WorkItem bug = bugs[0];
  16.             this.HandleExistingBug(bug, failedTest);
  17.         }
  18.         else
  19.         {
  20.             WorkItem bug = newWorkItem(type);
  21.             this.HandleNewBug(bug, failedTest);
  22.         }
  23.     }
  24. }
  25.  
  26. ///<summary>
  27. /// Handles existing bug resubmission.
  28. ///</summary>
  29. ///<param name="bug">The bug.</param>
  30. ///<param name="failedTest">The failed test.</param>
  31. publicvirtualvoid HandleExistingBug(WorkItem bug, GenericTestResult failedTest)
  32. {
  33.     if (bug.State == "Done" || bug.State == "Removed")
  34.     {
  35.         bug.Open();
  36.         bug.State = "New";
  37.         bug[CoreField.AssignedTo] = failedTest.Owner;
  38.         bug["Repro Steps"] = failedTest.Description + "<br />Expected: " +
  39.             failedTest.ExpectedResult + "<br />Actual: " +
  40.             failedTest.ActualResult;
  41.         bug.AreaPath = failedTest.AreaPath;
  42.         bug.IterationPath = failedTest.IterationPath;
  43.         if (!string.IsNullOrEmpty(failedTest.FileAttachment))
  44.         {
  45.             bug.Attachments.Clear();
  46.             bug.Attachments.Add(newAttachment(failedTest.FileAttachment));
  47.         }
  48.         if (bug.IsValid())
  49.         {
  50.             bug.Save();
  51.         }
  52.         else
  53.         {
  54.             foreach (Field field in bug.Validate())
  55.             {
  56.                 Console.WriteLine(field.Name + " did not validated. Field value: " + field.Value);
  57.             }
  58.         }
  59.     }
  60. }
  61.  
  62. ///<summary>
  63. /// Handles new bug submission.
  64. ///</summary>
  65. ///<param name="bug">The bug.</param>
  66. ///<param name="failedTest">The failed test.</param>
  67. publicvirtualvoid HandleNewBug(WorkItem bug, GenericTestResult failedTest)
  68. {
  69.     bug.Title = failedTest.Title;
  70.     bug[CoreField.AssignedTo] = failedTest.Owner;
  71.     bug["Repro Steps"] = failedTest.Description + "<br />Expected: " +
  72.             failedTest.ExpectedResult + "<br />Actual: " +
  73.             failedTest.ActualResult;
  74.     bug.AreaPath = failedTest.AreaPath;
  75.     bug.IterationPath = failedTest.IterationPath;
  76.     if (!string.IsNullOrEmpty(failedTest.FileAttachment))
  77.     {
  78.         bug.Attachments.Add(newAttachment(failedTest.FileAttachment));
  79.     }
  80.     if (bug.IsValid())
  81.     {
  82.         bug.Save();
  83.     }
  84.     else
  85.     {
  86.         foreach (Field field in bug.Validate())
  87.         {
  88.             Console.WriteLine(field.Name + " did not validated. Field value: " + field.Value);
  89.         }
  90.     }
  91. }
  92.  
  93. #endregion

There methods for handling the bug submission are made virtual in order for those methods be be overridden for different work item templates. We aren't assuming that the Scrum 2.2 template is the only thing out there. In fact we use a custom work item template and we have overridden those method in order to handle that template.

We still need some code to test though. At Infragistics we test the Ignite UI product this way but for the purpose of this post I have created a very simple JavaScript"framework" called framework.js and a few QUnittests for it called test1.html. The framework.js looks like this.

Code Snippet
  1. function Person(first, last, age) {
  2.     this.first = first;
  3.     this.last = last;
  4.     this.age = age;
  5.     this.getPropCount = function () {
  6.         var count = 0, prop;
  7.         for (prop inthis) {
  8.             count++;
  9.         }
  10.         return count;
  11.     }
  12.     this.compareFirstName = function (first) {
  13.         returnthis.first === first;
  14.     }
  15. }

The test1.html tests for this "framework" look like this.

Code Snippet
  1. <!DOCTYPEhtmlPUBLIC"-//W3C//DTD XHTML 1.0 Transitional//EN""http://www.w3.org/TR/xhtml1/DTD/xhtml1-transitional.dtd">
  2. <htmlxmlns="http://www.w3.org/1999/xhtml">
  3.  
  4. <head>
  5.     <metacharset="utf-8">
  6.     <title>QUnit Example</title>
  7.     <linkrel="stylesheet"href="QUnit/qunit-1.12.0.css"/>
  8.     <scripttype="text/javascript"src="QUnit/qunit-1.12.0.js"></script>
  9.     <scripttype="text/javascript"src="https://ajax.googleapis.com/ajax/libs/jquery/1.9.1/jquery.min.js"></script>
  10.     <scripttype="text/javascript"src="../Source/framework.js"></script>
  11.     <scripttype="text/javascript">
  12.         $(document).ready(function () {
  13.             test("Test Person API", function () {
  14.                 var person = new Person("Konstantin", "Dinev");
  15.                 equal(person.getPropCount(), 5, "The prop count returned from getPropCount has an incorrect value.");
  16.                 equal(person.compareFirstName("Konstantin"), true, "The first name comparison method of the Person object failed.");
  17.             });
  18.         });
  19.     </script>
  20. </head>
  21.  
  22. <body>
  23.     <divid="qunit"></div>
  24.     <divid="qunit-fixture"></div>
  25. </body>
  26.  
  27. </html>

So if we run the test file now the results look like this.


If we add code to the framework.js file that causes any of these tests to be failing we would get a bug submitted for that. Example would be to add an API method to the prototype of the Person class in framework.

Code Snippet
  1. Person.prototype.getLastName = function () {
  2.     returnthis.last;
  3. }

We now have one failing test and our TFS would reflect this by creating and submitting a bug.


The additional meta information needed to create this work item is acquired through a configuration for the test runner. The configuration for this particular execution looks like this.

Code Snippet
  1. <?xmlversion="1.0"encoding="utf-8" ?>
  2. <QUnitRunnerConfiguration>
  3.   <TestsRunnerConfiguration>
  4.     <TestSuites>
  5.       <TestSuite>
  6.         <Name>ISTA 2013 Test-1</Name>
  7.         <Owner>Konstantin Dinev</Owner>
  8.         <FileSystemFolder>E:\ISTA2013\Tests</FileSystemFolder>
  9.         <TestsFileName>test1.html</TestsFileName>
  10.         <MappedServerUrl>Tests</MappedServerUrl>
  11.         <SuiteCoverageFiles>
  12.           <File>framework.js</File>
  13.         </SuiteCoverageFiles>
  14.       </TestSuite>
  15.     </TestSuites>
  16.   </TestsRunnerConfiguration>
  17.   <TestsResultDispatcherConfiguration>
  18.     <MailServer>mail.test.com</MailServer>
  19.     <Sender>Automated Test Runner</Sender>
  20.     <Recipients>
  21.       <Email>email@test.com</Email>
  22.     </Recipients>
  23.     <Subject>ISTA 2013 Results</Subject>
  24.   </TestsResultDispatcherConfiguration>
  25. </QUnitRunnerConfiguration>

So that was the example implementation. You will find the runner attached with instruction on how to use it. Further should also look at potential problems that we might experience when adding such automated bug submission framework on top of our testing framework. What could go wrong? Well quite a few things!

            Problem: There could be multiple bug submissions coming from the same issue. If a large number of tests could be running with the infrastructure and a single commit/changeset may cause a number of existing tests to fail. What would prevent an automated bug submission framework from submitting a bug for every failed test.
            Solution: The tests should be analyzed as a batch instead of performing analysis on a single test at a time. This allows for identification of such issues.


            Problem: The person receiving the submitted bug still needs to perform manual analysis.
            Solution: Meaningful error messages must be provided with the test. The error message when an assert fails is the thing that we extract most information from. If that message is generic or is missing then we are increasing the time needed for analyzing the existing bug before fixing it.Also analysis is part of the bug-fixing process even now. Regardless of what analysis the Quality Engineer performed, the person working on the bug still needs to analyze the issue. In this sense we're still saving time.


            Problem: Developers require detailed information about the bug. The person responsible for fixing a bug usually asks for additional things like a stack trace.
            Solution: The infrastructure can submit any information provided by the IDE. Anything that the developer asks for and we extract using the IDE can be extracted and provided with the bug.


            Problem: Inconsistent tests. There are a lot of existing tests but some of them are inconsistent. They randomly fail.
            Solution: Test consistency analysis. This is currently not implemented with the framework but we have a very clear idea of how this problem can be handled. The failing tests need to be repeated. If they are rerun enough many times (definition of enough many depends on the implementation and on the tests and the tested software) and they show deltas in some of executions then they are inconsistent. If all the runs show the same results then they are consistent. This is a large topic by itself so I won't go into further detail.

As a conclusion we've examined the concepts for creating automated analysis of our automation executions and we've created a basic framework, proof of concept if you will, showing that these concepts are applicable. The expectation is for us to save at least some, if not all, of the time spent doing manual analysis of automation results. As I have already mentioned previously this framework is applicable and is being used already. Feel free to apply these concepts for the automation of your projects and hopefully it would prove useful. Feel free to send me any comments or questions!

Link to PowerPoint presentation on the topic.


Infragistics WPF Release Notes – November: 12.2, 13.1, 13.2 Service Releases

$
0
0

Release notes reflect the state of resolved bugs and new additions from the previous release. You will find these notes useful to help determine the resolution of existing issues from a past release and as a means of determining where to test your applications when upgrading from one version to the next.

Release notes are available in both PDF and Excel formats. The PDF summarizes the changes to this release along with a listing of each item. The Excel sheet includes each change item and makes it easy for you to sort, filter and otherwise manipulate the data to your liking.

In order to download release notes, use the following links:

WPF 2012 Volume 2 Service Release

PDF - Infragistics WPF 2012 Volume 2 (Build 12.2.20122.2292)
Excel - Infragistics WPF 2012 Volume 2 (Build 12.2.20122.2292)

WPF 2013 Volume 1 Service Release

PDF - Infragistics WPF 2013 Volume 1 (Build 13.1.20131.2230)
Excel - Infragistics WPF 2013 Volume 1 (Build 13.1.20131.2230)

WPF 2013 Volume 2 Service Release

PDF - NetAdvantage for WPF LOB 2011 Volume 2 (Build 13.2.20132.2005)
Excel - NetAdvantage for WPF LOB 2011 Volume 2 (Build 13.2.20132.2005)

Infragistics Silverlight Release Notes – November: 12.2, 13.1, 13.2 Service Releases

$
0
0

Release notes reflect the state of resolved bugs and new additions from the previous release. You will find these notes useful to help determine the resolution of existing issues from a past release and as a means of determining where to test your applications when upgrading from one version to the next.

Release notes are available in both PDF and Excel formats. The PDF summarizes the changes to this release along with a listing of each item. The Excel sheet includes each change item and makes it easy for you to sort, filter and otherwise manipulate the data to your liking.

In order to download release notes, use the following links:

Silverlight 2012 Volume 2 Service Release

PDF - Infragistics Silverlight 2012 Volume 2 (Build 12.2.20122.2283)
Excel - Infragistics Silverlight 2012 Volume 2 (Build 12.2.20122.2283)

Silverlight 2013 Volume 1 Service Release

PDF - Infragistics Silverlight 2013 Volume 1 (Build 13.1.20131.2221)
Excel - Infragistics Silverlight 2013 Volume 1 (Build 13.1.20131.2221)

Silverlight 2013 Volume 2 Service Release

PDF - Infragistics Silverlight 2013 Volume 2 (Build 13.2.20132.2006)
Excel - Infragistics Silverlight 2013 Volume 2 (Build 13.2.20132.2006)

NSHipster - iOS Resource of the Day

$
0
0

Just about every platform and programming language has way more features than any one person can explore. That’s a real shame because a lot of these overlooked features are really cool. Thankfully for Objective-C and Cocoa/UIKit we have today’s wonderful iOS resource, NSHipster.

logo

NSHipster - A journal of the overlooked bits in Obj-C and Cocoa

NSHipster is the brainchild of Mattt Thompson (yes, that’s Mattt with 3 T’s…he’s the Mobile Lead and Heroku and the creator of the wonderful AFNetworking library) and is a weekly journal of some of the cooler but often overlooked aspects of Objective-C and Cocoa/UIKit. The oldest article listed is dated July 12, 2012 so there are plenty of articles to read here.

One of the more recent articles dealt with iOS7. With Apple touting 1500 new APIs there was a ton of new material in iOS7. Rather than hitting on the ones everyone else was talking about, NSHipster chose to focus on some of the more interesting bits that might go overlooked like CIDetectorSmile and CIDetectorEyeBlink, AVSpeechSynthesizer, and MKDistanceFormatter.

Other posts are centered around improving your productivity as a developer. If you’re an Xcode developer, you’ll definitely want to check out the posts about Xcode key bindings and gestures and Xcode snippets. The post about xctool is all about helping you control the build process for your applications.

If books are more your thing, you’ll definitely want to check out the first edition of NSHipster as a PDF. The book combines articles from the site as well as new material written just for the book. It’s available for $19.

NSHipster-Book-Banner

Summary

NSHipster is an amazing resource that looks into the uncharted bits and pieces of Objective-C and Cocoa/UIKit. Since many of the APIs and features discussed on the site are applicable to Xamarin developers, people doing iOS development using C# should definitely check this out as well. There are some great articles to read on NSHipster and I’d recommend reading them all!

Contact

If you want to comment or reach out to me, the best place to do that is on Twitter @brentschooley. I can also be reached via email at bschooley@infragistics.com.

Ignite UI Release Notes - November: 12.2, 13.1, 13.2 Service Releases

$
0
0

NetAdvantage® for jQuery is now named Ignite UI™. Please see this blog post for more details. With every release comes a set of release notes that reflects the state of resolved bugs and new additions from the previous release. You’ll find the notes useful to help determine the resolution of existing issues from a past release and as a means of determining where to test your applications when upgrading from one version to the next.

Release notes are available in both PDF and Excel formats. The PDF summarizes the changes to this release along with a listing of each item. The Excel sheet includes each change item and makes it easy for you to sort, filter and otherwise manipulate the data to your liking.

Download the Release Notes

Ignite UI 2012 Volume 2

Ignite UI 2013 Volume 1

Ignite UI 2013 Volume 2

Infragistics ASP.NET Release Notes - November: 12.2, 13.1, 13.2 Service Releases

$
0
0

With every release comes a set of release notes that reflects the state of resolved bugs and new additions from the previous release. You’ll find the notes useful to help determine the resolution of existing issues from a past release and as a means of determining where to test your applications when upgrading from one version to the next.

Release notes are available in both PDF and Excel formats. The PDF summarizes the changes to this release along with a listing of each item. The Excel sheet includes each change item and makes it easy for you to sort, filter and otherwise manipulate the data to your liking.

Download the Release Notes

ASP.NET 2012 Volume 2

ASP.NET 2013 Volume 1

ASP.NET 2013 Volume 2


You Don’t Need a Usability Lab

$
0
0

Sadly, a lot of usability testing doesn’t happen because people think it requires an expensive usability lab. The term “lab” itself implies some kind of high-tech science experiment. It sounds formal, expensive, time consuming, and out of reach. But you don’t need a lab, and usability testing is actually often better when it’s not conducted in a lab.

Usability Testing in a Lab

Sure, there are advantages to conducting usability testing in a lab, but there are also some significant disadvantages. Let’s take a look at these.

Advantages of Testing in a Usability Lab

  • Usability labs provide the best environment for people to observe and listen, either through one-way mirrors or through video cameras fed to large screens.
  • More people come to observe usability testing when it’s conducted in a lab. Testing becomes more of an “event”. The novelty of it, the comfort of the observation room, the free food, and the chance to get out of the office are all powerful temptations to get people to attend. It’s always helpful to get people from the project team involved in observing the testing firsthand.
  • When more people come to observe testing, you can have debriefing sessions and discussions at various points during the day.
  • Usability labs give you the most control over the testing equipment, the environment, and the situation. You can ensure that each participant’s experience is the same. That’s important when you’re doing a test that relies primarily on collecting quantitative metrics.
  • Labs allow you to have the most high-tech setup, with eyetracking, mobile usability testing equipment, multiple cameras, audio recording, etc.
  • Since the participants come to you, you don’t have to travel, and you can fit more sessions in each day.

Disadvantages of Testing in a Usability Lab

  • A usability lab is a highly artificial environment. Taking people out of their normal context and bringing them into a lab does not show you their natural behavior.
  • Usability labs with the one way mirror, the cameras, and the observers can be intimidating and make participants feel uncomfortable. This can affect their behavior. Knowing that the designers and project team are observing can lead to the effect of participants telling you what they think you want to hear.
  • It’s harder to get people to participate in a usability test when they have to come to a lab. It’s easier to get them to participate when you can go to them or test them remotely. The best participants are often the ones that don’t have time to come to a usability lab. Those who are able to come to a lab are sometimes less-than-desirable or, even worse, “professional” participants who supplement their income by participating in focus groups and usability tests.
  • Because people have to travel to the lab in person, your participants are limited to those in the immediate area.
  • Usability labs are expensive. Lab space and equipment cost a lot of money, making usability testing more expensive.

Alternatives to a Usability Lab

If you don’t test in a usability lab, what are the alternatives? You can test participants remotely or you can go to the participants in person. Let’s look at the advantages and disadvantages of each method.

Remote Usability Testing

When you can’t meet with the participants in person, you can test them remotely by connecting with the participant through a phone call and a web conferencing application (like WebEx or GoToMeeting). The participant shares his or her screen so you can see them navigate through the interface. Project team members can observe by joining the web conference and listening in to the conference call.

Advantages

  • It’s easier to get people to participate in a 60 minute, remote session than it is to get them to come into a lab. Many participants are reluctant to leave work or home, but it’s easy for them to take an hour to participate remotely. You are more likely to get the right type of participants you need instead of “professional” focus group participants.
  • You can reach participants anywhere in the world without having to travel.
  • You can pay remote participants less because the test takes up less of their time.
  • People participate on their own computer, in their own environment, so you may see more realistic behavior.
  • Participants usually feel much more comfortable in their own environment, without a facilitator looking over their shoulder, without visible observers, and without cameras pointing at them. Their behavior is usually more natural when the awkward elements of the lab are absent.
  • It’s often easier to facilitate the session when a participant isn’t in the room, because instead of focusing on maintaining eye contact and your interpersonal interaction with the participant, you can focus more on observing the screen and taking notes.
  • It’s easier to get participants to think aloud as they perform tasks, because it seems to make sense to them that they need to explain what they’re doing since you’re not in the same room with them.

Disadvantages

Because you aren’t with the participants in person, you miss their facial expressions and body language. You miss the scowls, squinting, leaning into the monitor, head shakes, eye rolls, and yawns – all of which give you important signs of what the participant is feeling. You have to rely more on what they do onscreen and what they say. Sometimes you can observe them through a webcam, but that can be difficult for some people to set up.

  • It’s more difficult to create a rapport with participants when you’re not in the same room with them.
  • Participants sometimes have technical difficulties connecting to the web conference. These delays take valuable time away from the testing session.
  • Although observers can connect to the web conference session and conference call, fewer people bother to observe remote sessions. Those that do tend to get distracted by email and other work. You miss out on the discussions that happen when everyone gathers in an observation room.

Going to the Participants

Another option is to go to the participants and do the testing where they would use the interface you’re testing. That’s often at their office or home.

Advantages

  • Visiting participants in their “natural” environment is by far the most realistic testing situation. You’re most likely to see how they would really use the interface you’re testing when they’re using their own equipment in their own location.
  • Participants feel most comfortable doing the testing in their own location.
  • Being with the participant in person is a little more personal than remote testing. You’re able to build a better rapport with the participant when you’re physically with them.
  • It’s much easier to get people to participate when they don’t even have to leave their location.
  • You don’t need to setup any special equipment, unless you want to record the session.
  • It costs much less with no lab or equipment expenses.
  • The testing is very easy and informal.

Disadvantages

  • You have less control over the situation when each participant uses their own equipment. So this is not the best form of testing when you’re gathering quantitative metrics and need each participant to experience the same conditions.
  • Since they are using their own equipment, it’s more difficult to record the session. There are ways to record the session, but the quality may not be as good and it may add complexity to the session.
  • You have to travel to the participants, which takes time and costs money. Unless the participants are all in the same area, travel time cuts down the number of sessions you can perform in a day.

Going to the Participants and Setting up a Temporary Lab

If all the participants are near each other, you can go to them, set up in one location and have them come to you. For example, if you’re testing employees at a company, you can set up in a conference room. Another example is going to a trade show or other event and setting up a “lab” in a booth or conference room.

Advantages

  • It’s easier to get people to participate when they are already in the area and your temporary “lab” is nearby.
  • You can informally recruit people and get them to participate at the last minute. If you have no-show participants, you can easily get someone else to take their place.
  • Because you’re in one location and don’t have to travel, you can fit more participants into each day.
  • You have more control over the situation because you can set up the equipment and cameras ahead of time.
  • It’s easier to record the situation with software you have installed on the computer and the cameras you can set up in the room.
  • It’s easier when you need to use special testing equipment, like an eyetracker.
  • Every participant uses the same equipment, resulting in more consistency.
  • Although the participants are coming into this temporary “lab,” the location is usually less formal and intimidating than a usability lab.
  • It’s less expensive than a usability lab.

Disadvantages

  • You don’t see people in their own environment, using their own technology.
  • A temporary lab isn’t as intimidating or as unnatural as a traditional usability lab, but it’s not as natural and comfortable for participants as being at their own desk.
  • You have to bring and setup a lot of equipment.

So what Should You Use?

Each of the techniques listed above are valid options. The best choice depends on the type of testing you’re doing, where your participants are, and how much money you have. There’s nothing wrong with testing in a usability lab. It’s the right choice for certain situations, but you shouldn’t think that a lab is necessary. The alternatives I’ve described are often more natural and produce better results. So if you don’t have (or can’t afford) a lab, don’t worry. It’s probably better anyway. Don’t let that stop you from testing.


Image of observation room courtesy of Rosenfeld Media on Flickr under Creative Commons license.

A practical guide to validation in Indigo Studio

$
0
0

Introduction

At times it is expected to showcase validation mechanism in prototyping. Since prototyping tools are solely meant to prototype, this sort of functionalities may not be available. However considering the totality it can be debated that validation is an integral part of any application and many would like to capture it. Be it a developer, tester or Business analyst; everybody understands data validation and certainly UX Expert are no exception.

Today many developer tools offer various ways and means to support validation. Microsoft .NET provides validation controls e.g. Required Field validator, Range validator etc. and certainly other tools may have similar sorts of offerings to make developers life easy.

The good news is that it is possible to demonstrate validation using Indigo Studio. Though it may seem little difficult to start with but eventually the approach will make more sense. The same concept can be applied not only for validation but also to any system transition through various states.

Before we start please go through Screens Overview & Key Concepts . If you are new to Indigo Studio please visit Indigo Studio Help.

 What is state?

Use State when you have minor variation in the screen and/or screen transition is happening from one state to another. In this way it becomes very easy to maintain different states and reusability increases. For a detailed guideline regarding states refer this link. (Click here)

Demo

For simplicity I have chosen a very simple flow where all you need is to enter your name to go to next screen by pressing Login button. If name field is blank than a label is shown above text box (in red color) instructing to enter text. As soon as some text is entered the label goes away and again reappears when text box is blank. You can simulate it by entering text and delete it using Backspace.

This prototype is available online. Click here.

As per the demonstration there are two screens (a) Login Page (b) Main Page. Similarly in prototype we will make use of only 2 screens using “States”.


Below is the actual screen shot of state transition for our application in Indigo Studio. Analyze the flow and refer the description provided against each state.


Q - How the button in state 1.1.1 / 1.2 does redirect you to next page? Whereas the same button in all other states doesn’t? They are highlighted above inside brown circles.

Ans - In this state a duplicate Login button of same size is placed over original Login button at the same position. This new button points to next screen. That said the original Login button is hidden underneath the new button.

Similarly when text field is cleared (empty) the duplicate new button is removed and the original button underneath comes to front.

Note: Original button (As in start page) doesn’t point to any page. It displays the red label on top of text field when clicked.


Epilogue

We have now reached the final part where the focus would be to optimize the states by eliminating redundancy. If a state is similar to the other state than refer it instead of maintaining duplicate state.

A state is starting point for following states in the sequence. Therefore you should refer to a state that exists in the beginning of the transition.

For example there are two states highlighted inside green rectangle but only the bottom green rectangle can point to top green rectangle not vice versa. The bottom green state is not the first item in the sequence, whereas the top one does. For brown color, the top one needs to refer to bottom.

1st Stage Refinement: Refinement of states inside brown rectangle


 2nd Stage Refinement: Refinement of states inside green rectangle


Comparison

Comparing our final draft screen (in Indigo Studio) with initial state diagram will yield following result.

Download

You can download the above sample here. I have kept 3 versions of Login page as described in this topic. Enjoy prototyping in Indigo Studio.

Introduction to Geographic High Density Scatter Series in Ignite UI Map control

$
0
0

The igMap control uses the Canvas HTML5 tag to draw actual maps and visualize data on them. Choosing between different background content delivered by a map imagery provider (like Bing® Maps, CloudMade, or OpenStreetMap) you can display custom data and show it to the end user. In this blog we will go over the new feature of the control – the Geographic High-Density Scatter Series and make a sample that will show the earthquake activity in the last few years.

Earthquakes

Main Idea and features

The Geographic High Density Scatter Series feature, which is included in the 13.2 release of Ignite UI, binds and shows scattered data points ranging from hundreds to millions points represented by color pixels and loading extremely fast. The scatter series are based on the Cartesian coordinate to display values of two variables for set of data. The two variables are represented by the latitude and longitude values.This feature is meant to deal with a great amount of data, that is why when there is a high density of points, they start to coalesce and color  in different tint. All of this is handled by the control’s many options which help you visualize your data in more accessible and more comprehensible way. For example you can use the heat maximum and heat minimum options to set the density value that maps respectively to the maximum and minimum heat color. In that way when you zoom in you will be able to see the separate pixels in the color you have chosen for the minimum heat, and when you zoom out you will see how the areas that are more saturated with points begin to change their color to the one you have set to the max heat option.

Code:

  1. heatMinimum: 0,
  2. heatMaximum: 5,
  3. heatMaximumColor: "red",
  4. heatMinimumColor: "yellow"

Image:

ZoomIn ZoomOut effect


By using the point extent option which enlarge the points’ size, you will achieve the effect of a heat map, but be aware that the point size affects the series performance – meaning that the higher the property value is the lower the performance will be.

  1. pointExtent:3


Image:

Heat Map

Another way to change the pixels is by setting the series object’s resolution a value bigger than 1, which is the default value. Using a low value means better resolution, but diminished performance.

If you want your data to load in less time and use less memory you can set the use brutal force property which renders all the data points every time, when true, rather than building its internal data structures. To render tooltips, you should first set the mouseOverEnabled property to true. That way the mouseOver event will be permitted.

You can find more information about the feature and it’s properties in the product's API  or in the documentation. And you can see live demo in the sample browser.

The Sample

To begin with we need a div tag for placing our map control. After that we initialize the control using the following lines:

  1. <divid="map"></div>


  1. $("#map").igMap({
  2.     width: "500px",
  3.     height: "500px"
  4. }

By using the backGroundContent property you can choose what kind of map to use. In this sample we will use a Bing map and we will give the imagerySet property, the AerialWithLabels value. That way we will have a physical map of different countries and cities of the world.

JS:

  1. $("#map").igMap({
  2.     width: "500px",
  3.     height: "500px",
  4.     backgroundContent: {
  5.         type: "bing",
  6.         key: "123456abcdef",
  7.         imagerySet: "AerialWithLabels "
  8.     }
  9. }

MVC:

  1. @(Html.Infragistics().Map(Model)
  2.     .ID("map")
  3.     .Width("500px")
  4.     .Height("500px")
  5.     .BackgroundContent(bgr => bgr.BingMaps("123456abcdef")
  6.                 .ImagerySet(ImagerySet.Aerial))
  7.     .Render()    
  8. )

If you want to be able to zoom in and zoom out the map, you should set the verticalZoomable and the horizontalZoomable to true. The last thing to add to our control configuration is the series. Well we want to display the earthquakes all over the world that is why we need appropriate data like that:

  1. var events =[
  2. { lat:"18.871" , lng:"146.2927" , dkm:"99.9" , mag:"5.7" , source:"NEIC" , date:"2011/06/26 09:19:48.2000"},
  3. { lat: "42.0", lng: "142.62", dkm: "44.2", mag: "5.6", source: "NEIC", date: "2011/06/24 17:39:25.0000" },
  4. . . .
  5. ];

The data we are using is the same as in the  Earthquake sample, which is taken from National Earthquake Information Center. Now in the series we take the data by setting the dataSource option to – events, and for the latitudeMemberPath and the longitudeMemberPath properties we use he respective items from the data. So our code will look like this:

JS:

  1. series: [{
  2.     type: "geographicHighDensityScatter",
  3.     name: "earthQuakes",
  4.     dataSource: events,
  5.     latitudeMemberPath: "lat",
  6.     longitudeMemberPath: "lng",
  7.     heatMinimum: 0,
  8.     heatMaximum: 5,
  9.     heatMaximumColor: "red",
  10.     heatMinimumColor: "orange",
  11. }]

MVC:

  1. .Series(series =>
  2. {
  3.     series.GeographicHighDensityScatter("earthQuakes")
  4.         .LatitudeMemberPath("Lat")
  5.         .LongitudeMemberPath("Lng")
  6.         .HeatMaximum(5)
  7.         .HeatMinimum(0);
  8. })

Image:

Geographic High Density Scatter Series


Conclusion

The Ignite UI  Geographic High Density Scatter Series feature of the igMap control, comes in handy when you need to display a large amount of data over the map. With its overflowing points you can easily show the most saturated places and thus help the end users make conclusions based on the presented data. For instance you can show all of the cities in US and the map will look like that:

Cities in US


You can find the sample ASP.NET MVC project demo.


Downliad Ignite UI

You can follow us on Twitter @Infragistics and stay in touch on Facebook, Google+ and LinkedIn!

jQuery Bulgaria 2013–Event Recap

$
0
0

On November 30 was held the first in Eastern Europe jQuery Conference . jQuery Bulgaria is the largest free community event in Bulgaria with 700+ participants


What is jQuery Bulgaria


  • The very first conference in Bulgaria dedicated to jQuery and related JS frameworks
  • Community event organized with the support of Infragistics, jQuery Sofia UG and many volunteers
  • jQuery Bulgaria is FREE – attendees are not charged !
  • Thanks to the sponsors who helped cover the expenses!
  • An one day event with sessions dedicated to all that is jQuery.
  • It is a chance for the local community to immerse in their favorite web technologies
  • The largest event for WEB developers in Bulgaria
  • The largest community event in Bulgaria
  • The larges free event in Bulgaria


Event history:

After a few successful “Saturday” format events across different platforms, the JavaScript event received major interest.

Infragistics confirmed its support for the event: Thanks to Jason Beres: VP of Product Management, Community and Evangelism @ Infragistics
Community leaders also confirmed their support: Community leaders also confirmed their support: Thanks to Boris Simandoff!

We chose Inter Expo Center as the best location for this event.

All our speakers are also volunteers – they decided to cover their own expenses to be possible to avoid charging community members


Infragistics participation in the event:

Infragistics was the main sponsor and organizer of the event.

There was 3 technical presentation from Infragistics Inc.:


Some statistic

  • 700+ attendees
  • First jQuery event in Bulgaria
  • The biggest event for WEB developers in Bulgaria
  • The biggest free event for developers in Bulgaria
  • Average event rating : 4.30 (scale 1 to 5)
  • Average sessions rating : 4:05 (scale 1 to 5)
  • 20 sessions in 4 tracks
  • Attendees from 7 countries (USA, Ukraine, Russia, Macedonia, Serbia , Nederland and Bulgaria)
  • Speakers from 5 countries (USA, Ukraine, Russia, Macedonia and Bulgaria )

Pictures from the event:

Some photos are available here– special thanks to Viktor Nonov

Photos from the official event photograph are available here:


More information about the event can be found at jQuery Bulgaria website (www.jquerybulgaria.com ) , Facebook page jQuery Bulgaria ( https://www.facebook.com/jquerybulgaria) and  on Twitter @jQueryBulgaria

Presentations from jQuery Bulgaria are available here:  [Query Bulgaria schedule]:


As always, you can follow us on Twitter @mihailmateev and @Infragistics and stay in touch onFacebook,Google+andLinkedIn!


Creating a navigation menu with Windows Forms and Infragistics Live Tile View control

$
0
0

We have all seen the Windows 8 and 8.1 start menu with its colorful tiles of different size and with different functionality. In the new 13.2 release of Windows Forms Infragistics presented a new control called Win Live Tile View, which allows you to create a navigation menu similar to the Windows one. This control gives you the opportunity to choose between more than fifty different tiles and thus create a beautiful, flexible and user friendly applications. The greatest thing about it is that you can navigate it in two ways by adding some back-end code or by using the visual designer which will generate the code-behind for you. Lets take a look at the functionality of the control and create a sample like those ones:

Navigation

Getting Started

To begin with, I want to mention that in the documentation of the control you can find a full, step-by-step explanation of how to add Win Live Tile Vie using the designer and how to add it in the Code-behind. For the sample we are going to create we will use the Designer. Adding the control to our Windows Form Application is really easy. As you have already installed the Infragistics packages for Windows Forms you can find the whole list of controls in the toolbox. Find the UltraLiveTileView control in the toolbox and drop it onto the Form. When you do that you will see the so called smart tag.

smart tag

When you click on the UltraLiveTileView Designer tag, the designer will appear. Now that you have opened the designer you can choose from the templates different tiles and by dragging and dropping them you can create your groups of tiles.

designer

When you click on a particular tile you will see three options: delete, clone, edit. To customize your tile you can select the edit option and thus you will open an editor windows, where you can change the type of the tile, you can set an image or a background to the tile and you can change the heading or the text of the tile.

editor

You can have as many tiles in a group as you want and they can be of a different size. You can also make live tiles with animation – meaning that they can change their appearance after few seconds. You can achieve this by following those steps:

1. Add a live tile.

2. Add more frames to the frame collection. That will result in animating the frames.

You can add more frames to the collections by going to the Default View option in the properties and then choosing the type of frame you are going to animate. In the user mode users can change the size of the tiles, so if you want the animation to occur only to the default size of the tile change only that collection, but if you want it to animate even when it is resized change all all of the collections. The animation option allows you to  determine the way it will act. The options are : Slide from top, slide from left, slide from right or from the bottom or fade. You can also set the interval after which the frames will change.

creating animation

Functionality

So we saw how to add tiles and group them, now lets take a look at the way they can act. For our sample we will make tiles that can open browser, tiles which will execute another forms and tiles that can open default programs.

All you have to do is handle the tile click event and perform an action based on the tile’s unique key. It can be anything available to you – like starting processes like browser from a link or a default program like windows explorer.:

  1. privatevoid ultraLiveTileView1_TileClick(object sender, Infragistics.Win.UltraWinLiveTileView.TileClickEventArgs e)
  2. {
  3.     if (e.Tile.Key == "chrom")
  4.     System.Diagnostics.Process.Start("http://google.com");
  5.     
  6.     if (e.Tile.Key == "explorer")
  7.     System.Diagnostics.Process.Start("explorer.exe");
  8. }

Or you can show other forms from like those one:

Example:

  1. if (e.Tile.Key == "calculator")
  2. {
  3.     Calculator calc = newCalculator();
  4.     calc.Show();
  5. }


calculator


  1. if (e.Tile.Key == "movies")
  2. {
  3.     Movies movie = newMovies();
  4.     movie.Show();
  5. }


movies

In the user mode of the application the users can rearrange the tiles as they want . They can move them from one group to another, change the order of the groups or the order of the tiles. That is why it is good to allow you application to save the changes in the  layout, and then when you reopen it the new layout will load. You can do that by using the following functions: SaveAsXml and LoadFromXml. Create a form closing event and add the following lines:

  1. privatevoid Form1_FormClosing(object sender, FormClosingEventArgs e)
  2. {
  3.     this.ultraLiveTileView1.SaveAsXml("LiveTileConfig.xml");
  4. }

Then you can check for this file when the form is created and restore the tiles configuration.

  1. public Form1()
  2. {
  3.     InitializeComponent();
  4.     if (File.Exists("LiveTileConfig.xml"))
  5.     {
  6.        this.ultraLiveTileView1.LoadFromXml("LiveTileConfig.xml");
  7.     }
  8. }

Summary

Creating applications using the WinLiveTileView control for Windows Form is actually very easy and entertaining. This control can serve as a navigation ‘hub’ for an application and you can build a beautiful and functional one in no time using the designer and you can manipulate and customize the tiles anyway you like. In the movies sample as you can see we have changed the background of the form and the background of the groups, which makes it even more appealing. So unleash you imagination and create attractive and easy to access navigation menus.


You can check out all of the Infragistics Windows Forms controls and also download the sample project.

Viewing all 2223 articles
Browse latest View live